


By Michael Roberts
The calculator in the last post shows that installing solar is an incredibly valuable investment for households and businesses with the physical and financial ability to do it. The gains are so large that some wonder why the state is nearly breaking its budget to subsidize what would still, even without the state tax credit, be a windfall gain for the typically wealthy households able to take advantage of the situation.
Things can look different at the system level. Even if there is enough rooftop space available, we can’t all install solar, because of a mismatch between electricity generation and electricity use. It works well when only a fraction of households have solar, because those with solar panels effectively sell their electricity to their neighbors when they can’t use all of it, then buy it back later when the sun isn’t shining. Put another way, the existing electric grid effectively serves as the solar household’s battery. Under current net metering agreements the household’s price for that battery is just $17 per month, plus any surplus generation not used over the course of a year (which might actually be considerable).
The situation is similar for wind. Few if any of us will have windmills on top of our houses. But nature’s variable supply of electricity from the wind, like the sun, doesn’t perfectly match our varying collective desire to consume electricity.
Our Grid Manager
Hawaiian Electric, our grid manager (unless you’re on Kauai) adjusts power from dispatchable sources (fossil fuel power plants) to compensate for variability from renewables. If the share of renewable energy is modest, this is a fairly easy thing to do. In fact, a modest amount of solar makes this job easier, because it knocks down peak loads on hot days. Small, oil-burning generators satisfy peak loads, but these cost about two-and-half times the average cost of generation.
To get a sense of how the whole system works, the graph below shows load activity over the coarse of seven warm days in October, with a high peak load and light, variable wind. The load curve varies throughout each day, with more electricity consumed in mid-day and early evening, and then falling off at night. Weekend loads (the last two humps) are a bit lower than weekday loads. In the warmer months, midday spikes more, mainly due to air conditioning and industrial uses. In winter midday loads are a bit lower.
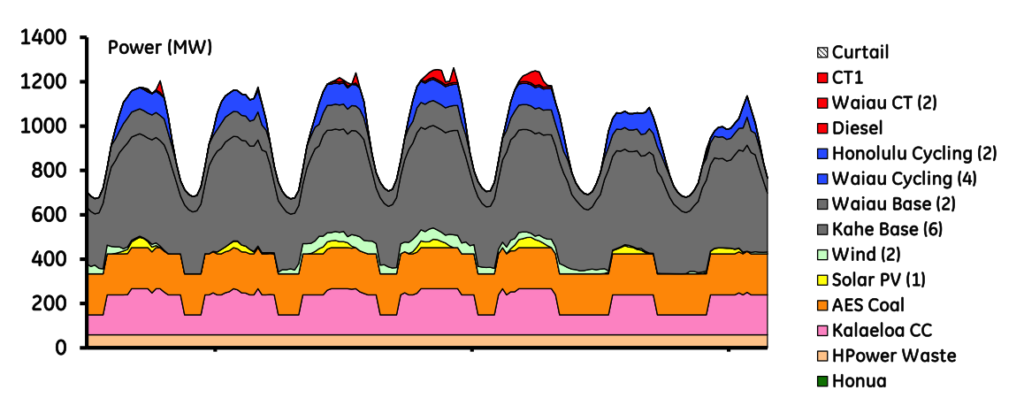
Different sources of electricity fill up the load curve. The load is typically satisfied with least-flexible, and typically least-expensive sources first. Oahu’s coal power plant generates electricity at just 5 cents/kWh, but its loads are difficult to ramp up and ramp down as demand or renewable supply changes. This power plant helps to keep Oahu’s prices lower than the other islands, but we’re probably too small to have another base load powerplant like this one. Cycling generators are more flexible, but also cost more per kWh. Peaking generators, in red, are the most flexible, but very expensive and are only turned on when they have to be.
The load shares beneath the curve were derived from a model developed by GE Energy Consulting. Validation exercises show this model fits the actual situation extremely well, so it has been the basis of studies considering how different levels of renewable energy can fit onto the grid.
In the graph, we can see that solar provides energy when cycling and peaking generators are also being used. That means the electricity is worth a lot more than average. However, in this graph solar is just 1.2% of total generation and wind is 3.6%. In winter, midday load is less and solar would mainly displace cycling generators.
Solar energy can be especially valuable
If solar increases to 7.5% percent of the average load holding all else the same (for perspective, we’re currently around 5%), the energy provided remains fairly valuable, displacing peak and cycling generators. But more reserves are needed to stabilize unexpected variability from renewables.
By knocking down peak loads, Hawaiian Electric’s cost savings from solar installations may be substantially greater than suggested in our last post. The report by GE Energy Consulting shows that, averaging over the whole year, increasing solar by 6.3 percent (from 1.2 to 7.5) reduces HECO’s oil generation costs by 9.2%, which suggests that HECO’s savings from solar is about 46% higher than their average cost of generation. This would put HECO’s per kWh savings roughly on par with their revenue loss. And that’s not counting surplus generation under net metering agreements or the revenue-decoupling rule.
Bigger challenges at higher penetration levels
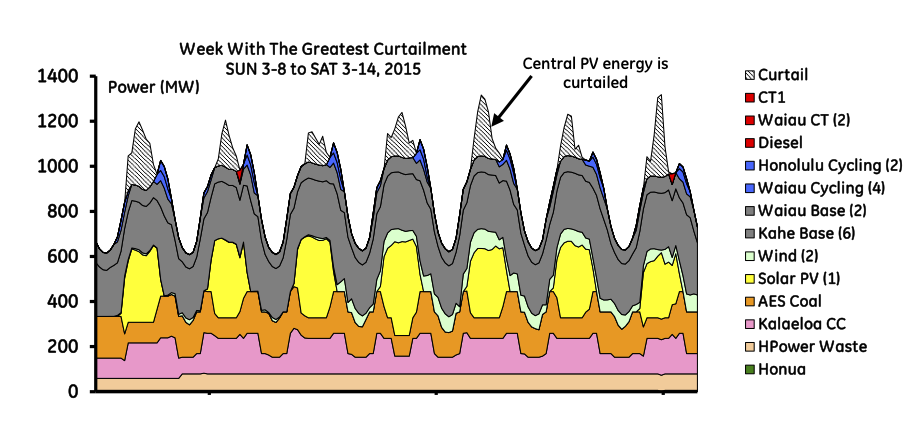
At current penetration levels, solar remains valuable. But Hawaii is striving for 40% renewable energy, possibly much more. When penetration levels increase, it becomes more difficult to adjust directed sources in response to varying renewables. The graph below looks at an especially cool but sunny week in March assuming 14.8% solar penetration, or nearly three times our current level. Under the current system, a lot of the solar energy would have to be “curtailed” (discarded), since base loads could not be economically reduced to accommodate it. Here, solar becomes a lot less valuable at high penetration levels. This level of green energy will require more creative grid management, more flexible and expensive generators, batteries, and/or shifting of load from the evening to when the wind is blowing or midday when the sun is shining brightest. These investments could be costly. Without these major investments, pushing PV solar from 7.5% to 14.8% reduces costs from dispatchable sources by only 6%. Where the first 7.5% of PV solar is worth considerably more than average, the next 7.3% of solar is worth about 18% less than average.
Circuit-level challenges
Part of the difficulty is that our electric grid wasn’t designed for renewables. It was made for directing electricity out from power plants to homes and businesses. But residential solar is distributed, which means electricity may need to flow in different directions than our grid was designed to handle. To manage the backflow, new transformers need to be installed to allow energy to flow more easily to and from neighborhood circuits. These potential challenges have recently stalled solar installations in circuits that are approaching risk of backflow. Although, one may wonder why Hawaiian Electric’s rapidly increasing net revenue cannot cover the cost of such upgrades.
New solar inverters and transformer upgrades might improve circuit-level problems. However, it would probably be more cost effective to install solar in circuits with less penetration, or develop more utility-scale solar and wind power plants.
The plummeting cost of renewables
Where the cost of residential solar now runs about $4/Watt (which pencils out around 20 cents/kWh using our calculator, unsubsidized), utility-scale costs now average under $2/Watt, or 11 cents/kWh unsubsidized, or about half Hawaiian Electric’s costs from fossil fuel sources. Wind is even more cost effective than PV solar. Plus, Federal subsidies alone currently cover 30-40% of the cost of utility-scale renewables.
Thus, despite new grid challenges with renewables, Hawai’i ought to be charting a path toward much greener and much cheaper electricity. We’re starting to see a lot more renewable energy, but prices have been going up, not down. Current proposed purchasing power agreements at around 15.7 cents per kWh, while lower than existing agreements, still seem too high.
In subsequent posts we’ll write more about current policy, rapidly changing technology, and alternative paths going forward.
BLOG POSTS ARE PRELIMINARY MATERIALS CIRCULATED TO STIMULATE DISCUSSION AND CRITICAL COMMENT. THE VIEWS EXPRESSED ARE THOSE OF THE INDIVIDUAL AUTHORS. WHILE BLOG POSTS BENEFIT FROM ACTIVE UHERO DISCUSSION, THEY HAVE NOT UNDERGONE FORMAL ACADEMIC PEER REVIEW.