


BLOG POSTS ARE PRELIMINARY MATERIALS CIRCULATED TO STIMULATE DISCUSSION AND CRITICAL COMMENT. THE VIEWS EXPRESSED ARE THOSE OF THE INDIVIDUAL AUTHORS. WHILE BLOG POSTS BENEFIT FROM ACTIVE UHERO DISCUSSION, THEY HAVE NOT UNDERGONE FORMAL ACADEMIC PEER REVIEW.
By Peter Fuleky
COVID-19 has brought the longest period of economic expansion in modern history to an abrupt halt. The pace and magnitude of decline in economic activity has been unprecedented, and the recovery ahead will likely be drawn-out and uneven. Making good business and public policy decisions in such a rapidly-changing environment requires data that is as timely as possible. With this in mind, we have developed a weekly coincident index of economic activity for Hawaii. As we will show below, this new UHERO Economic Pulse index captures both the steep drop and sluggish recovery seen across many economic indicators in the wake of the COVID-19 outbreak.
Traditionally, macroeconomic models have relied on “low-frequency” time series, data measured at the monthly, quarterly or even annual frequency. Often this lower-frequency data is released with a substantial delay—especially for subnational regions—dramatically diminishing the timeliness of the information. A large share of data collected by private entities remains unavailable to the public or is only reported at the national level. But recognizing the need for timely information in the wake of the COVID-19 outbreak, some companies have begun sharing data that can be used to track economic conditions with only a very short time lag.
The type and extent of available data plays an important role in choosing an appropriate method to track changing economic conditions. Many techniques attempt to filter out the signal from the noise, that is to separate relevant from irrelevant information, contained in a large set of indicators. An index is then computed as a weighted average of the observed time series, with higher weights given to more informative data. There are a number of ways to choose the optimal weights assigned to each indicator. We use principal component analysis (PCA), since the method works well with short samples, and much of the relevant high frequency data has only been made available since the emergence of COVID-19.
Our data set contains the eighteen variables listed in Table 1. The input variables cover various facets of the economy, including the labor market, consumer behavior, and locally important business conditions in the tourism and restaurant industries. In contrast to traditional approaches, the index developed here incorporates several measures of mobility that capture the impact of stay-at-home and physical-distancing behavior that have followed the COVID-19 outbreak.
| Variable | Description | Source |
| air_passengers | Number of deplaning passengers in Hawaii (yoy) | DBEDT |
| business_open | Businesses open % change relative to January, 2020 (idx) | Homebase |
| cont_claims | Continuing claims of unemployment insurance benefits (yoy, inv) | HI Department of Labor |
| empl_working | Employees working % change relative to January, 2020 (idx) | Homebase |
| hours_worked | Hours worked % change relative to January, 2020 (idx) | Homebase |
| job_postings | Average level of job postings relative to January 4-31 2020 (idx) | Burning Glass |
| mei_dallas_fed | Deviation from normal mobility behaviors induced by COVID-19 (idx) | Dallas Fed |
| mobility_hi | Typical distance traveled in a day (idx) | Descartes Labs |
| opentable_diners | Year-over-year % change in seated diners (yoy) | OpenTable |
| proc_payrolls | Volume of processed payrolls (yoy) | ProService Hawaii |
| search_covid | Search volume for “covid” in Hawaii (inv) | Google Trends |
| time_at_grocery | Time spent at grocery and pharmacy location relative to Jan 3-Feb 6 2020 (idx) | Google Mobility |
| time_at_parks | Time spent at parks relative to Jan 3-Feb 6 2020 (idx) | Google Mobility |
| time_at_resid | Time spent at residential locations relative to Jan 3-Feb 6 2020 (idx, inv) | Google Mobility |
| time_at_retail | Time spent at retail and recreation locations relative to Jan 3-Feb 6 2020 (idx) | Google Mobility |
| time_at_transit | Time at/inside transit stations relative to Jan 3-Feb 6 2020 (idx) | Google Mobility |
| time_at_work | Time spent at work places relative to Jan 3-Feb 6 2020 (idx) | Google Mobility |
| traffic_volume | Road traffic volume relative to the 2019 annual average (idx) | HI Department of Transportation |
Table 1: Variable descriptions. Transformations of the variables are indicated in parentheses: yoy = year-over-year change, idx = indexed to the beginning of 2020, inv = inverted sign. For additional information, see Nowcasting the Trajectory of the COVID-19 Recovery.
Where an individual data series extends back to 2019 or earlier, we express the data as year-over-year changes. This has the advantage of eliminating most of the seasonality in the data. For data series where observations began only in early 2020, the data are indexed relative to the pre-pandemic period. Additional information about data collection and transformation is available on the websites of the sources linked in the third column of Table 1. Since PCA is sensitive to the unit of measurement, each variable is standardized to have a zero mean and unit variance. Continuing unemployment claims, Google searches for “COVID”, and time spent at residential locations are inversely related to economic activity, and so these variables are inverted by multiplying their values by negative one.
We use the PCA method to capture the dominant common movements in the set of indicators. Figure 1 demonstrates the relationship between each series and the first principal component—the weekly UHERO Economic Pulse index. The index captures more than 80% of the overall variation in the sample and exhibits statistically significant correlation with each underlying series. Since it consolidates the common signal about the business cycle, the index is a useful summary measure of overall economic conditions. When normalized, by setting its peak to 100% and the trough to 0%, recent values of the UHERO Economic Pulse represent the extent of recovery from the COVID-19 shut-down in April.
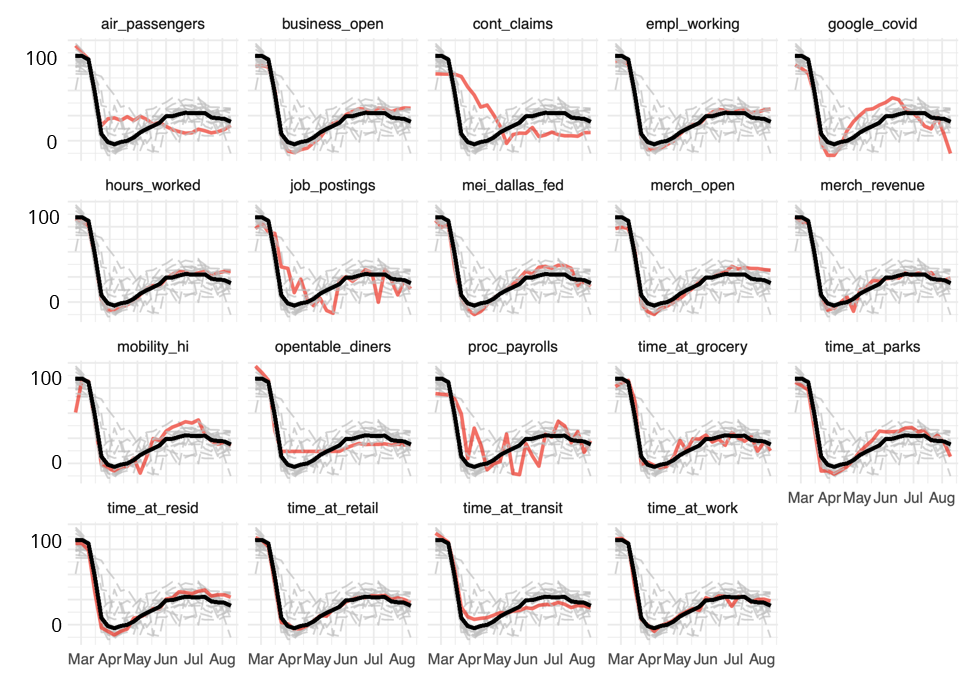
Figure 1: Time plots of the first principal component (the weekly UHERO Economic Pulse index) and the underlying variables. Each panel illustrates the evolution of the index (black) and the variable denoted in the panel heading (highlighted in red). The continuing_claims, google_search_covid, and time_at_resid variables are multiplied by -1 since they tend to be inversely related to the other variables.
In addition, the index is valuable to forecasters since it helps to determine the starting point for a prediction. The Federal Reserve Bank of Philadelphia produces a monthly coincident index for each of the fifty states, but it is released with an approximately four-week lag. In contrast, we release the weekly UHERO Economic Pulse on Fridays following the reference week, increasing its usefulness in the current fast-paced environment.
Figure 2 illustrates the relationship between the weekly UHERO Economic Pulse and two monthly economic indicators: nonfarm payrolls in the left pane and the Philly Fed coincident index in the right pane. The UHERO index approximates the evolution of these two broad-based economic measures—released 3-4 weeks after the reference month—quite well. And the weekly UHERO Economic Pulse can provide this information in a very timely manner.
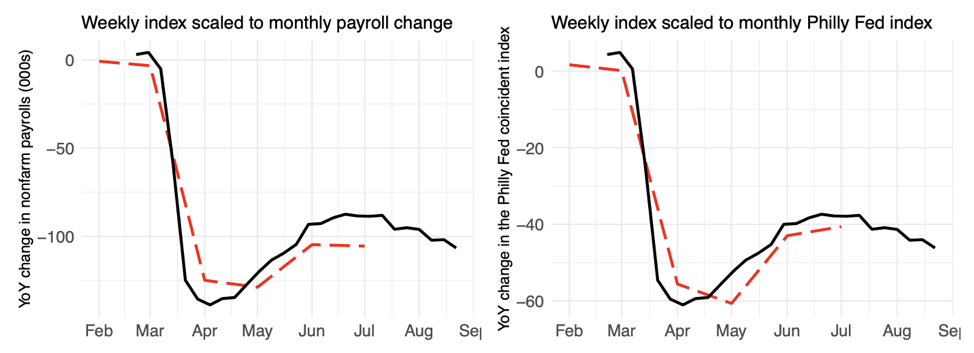
Figure 2: Time plot of the weekly UHERO Economic Pulse index (black) and nonfarm payrolls and the Philadelphia Fed coincident index (red).
The UHERO Economic Pulse index suggests that Hawaii’s nascent and weak recovery began faltering in mid-July, just after the expiration of the Paycheck Protection Program and the onset of the second wave of COVID-19 infections in Hawaii. Needless to say, timely information of this kind is essential information for businesses and public leaders if they are to make the best possible policy decisions. The index will be an important input to our own deliberations as we track the economy’s ups (or downs) in coming months.
3 thoughts on “Nowcasting the Trajectory of the COVID-19 Recovery: <br /> The Weekly UHERO Economic Pulse”
Thanks for your work. It is very interesting to read the opinion and analysis of the professionals in business research.
Thank you for publishing this analysis Peter, it has been critical to understanding the local economic trends for our customers. Please also post the summary slide you presented in the Civil Beat economics webinar last week, with the economic pulse curve overlaid on the other indicators.
Thank you Joelle for your comment. I am glad this analysis has been helpful. Here is the slide with the UHERO Pulse and the underlying series: https://uhero.hawaii.edu/wp-content/uploads/2020/09/UHEP.pdf