
UHERO Reports
Assessing Honolulu’s “Bill 7” Housing Program

Honolulu’s Affordable Rental Housing Program, commonly known as “Bill 7,” was enacted in 2019 to make small-scale infill apartment development financially feasible while keeping most new units affordable to moderate-income households. The program offers additional density, fee waivers, grants, tax incentives, and relief from some zoning and building standards in exchange for affordability restrictions. Since 2019, 85 projects containing 2,280 units have entered the program, but only seven projects and 224 units have been completed—well below the statutory goal of 500 completed units per year. Another 776 units in 22 projects have received permits as of September 2026.
The findings and recommendations are those of the authors and do not necessarily reflect the views or official positions of UHERO, the University of Hawai’i, or any funding or supporting organization.
Funding provided by the City and County of Honolulu, Department of Housing and Land Management
View Full Report
Executive Summary
Honolulu’s Affordable Rental Housing Program, commonly known as “Bill 7,” was enacted in 2019 to make small-scale infill apartment development financially feasible while keeping most new units affordable to moderate-income households. The program offers additional density, fee waivers, grants, tax incentives, and relief from some zoning and building standards in exchange for affordability restrictions. Since 2019, 85 projects containing 2,280 units have entered the program, but only seven projects and 224 units have been completed—well below the statutory goal of 500 completed units per year. Another 776 units in 22 projects have received permits as of September 2026.
This report uses UHERO’s Housing Policy Simulator to estimate how much Bill 7 improves project feasibility and which policy changes could improve it further. On a representative 10,000-square-foot parcel in a medium-density apartment district (A-2), Bill 7 increased the potential project size from 26 to 49 units and raised estimated return on cost from 5.0% to 6.2% compared with the zoning rules in effect before 2026. While this was a substantial improvement in feasibility in absolute terms, it still falls short of the industry target of 6.6%, which helps to explain why more projects have not been proposed and completed under the program.
Higher interest rates and construction costs have made development more difficult since 2019, while permitting times have remained well beyond the 90-day timeline set out in Chapter 32. Broader zoning and building code reforms have also extended several Bill 7 advantages to ordinary projects, including eliminating parking requirements in Ordinance 20-41 and allowing a single staircase to serve up to 3 floors as fire egress (ROH §16-1.1(85)). Most notably, Ordinance 26-7 increased allowable density in apartment districts, improving feasibility for standard projects and narrowing Bill 7’s return-on-cost advantage in a simulated project from 122 basis points to 74. Even so, Bill 7 vastly outperforms the standard pathway on residual land value, due to fee waivers, construction subsidies, and property tax exemptions. The City waives more than $950,000 in fees for Bill 7 projects compared to non-Bill 7 ones. Our simulated Bill 7 projects approach feasibility on 47% (3,658) of the 7,855 parcels eligible for the program, for a total of 143,574 potential units. No simulated standard project on the same parcels clears the same near-feasibility threshold at comparable rents.
A sensitivity analysis demonstrates two main paths to improve feasibility further: increasing units per project or increasing subsidy amounts. A density bonus allowing 55% more units per project, through a combination of height, FAR, and unit cap increases, would raise the simulated project’s return on cost from 6.2% to 6.5% and its residual land value by 61% without increasing the City’s per unit subsidy. Incidentally, the city’s new “pre-construction grant” is awarded during construction, and is earmarked to cover the cost of prevailing wages; both of these features limit its impact on feasibility. Paying the same amount before construction and without encumbrance would raise its contribution to land value by 31%. Fee waivers, though valuable, are already maximally deployed, with 98.4% of all fees waived for Bill 7 projects.
Despite unexpected macroeconomic challenges, the Bill 7 program has produced hundreds of workforce housing units in central locations with excellent transit access. It is a housing program that also furthers the City’s transportation, economic development, and sustainability goals. If the City wishes to maintain and extend a feasibility advantage for the program over market-rate projects, policymakers could raise limits that constrain units per project, accelerate permitting, or increase or restructure subsidies.
Background
ROH Chapter 32, sometimes called the “Bill 7 Program,” is an alternative permitting pathway designed to stimulate the development of apartments affordable to typical households on small lots in areas zoned for multi-family housing. It combines aspects of both infill development and workforce housing programs familiar in other U.S. cities. The Bill 7 program applies exclusively to lots of 20,000 square feet or less within the Apartment, Apartment Mixed-Use, and Business Mixed-Use zoning districts, as well as the apartment precinct and apartment mixed-use sub-precinct of the Waikiki Special District, and is currently slated to expire in 2030. Developers are required to rent 80% of the apartments to households earning 100% AMI or less for at least 15 years[1]. In exchange, the program offers a mix of regulatory and financial incentives to improve project feasibility.
Regulatory relief includes an exemption from off-street parking requirements (ROH §32-2.3) along with relaxed density and height limits–up to 4.0 floor area ratio (FAR) and 60 feet, respectively. Financially, the program waives building permit and plan review fees (ROH §18-6.5(i)), park dedication requirements (ROH §22-7.3(j)), and wastewater system facility charges (ROH §43-10.8(a)), and the Board of Water Supply may waive water system facility charges and new meter costs for projects certified by DPP (City and County of Honolulu Department of Planning and Permitting, n.d.). The program also offers developers either a post-construction cash grant of up to $12,000 per affordable unit (Ordinance 24-23) or a pre-construction subsidy of up to $50,000 per unit with a prevailing wage requirement (Ordinance 25-19). Developers that commit to deeper affordability than is required (80% AMI) also qualify for real property tax exemptions on those units (ROH §8-10.33).
Figure 1: Bill 7 Pipeline, 2019 to 2026
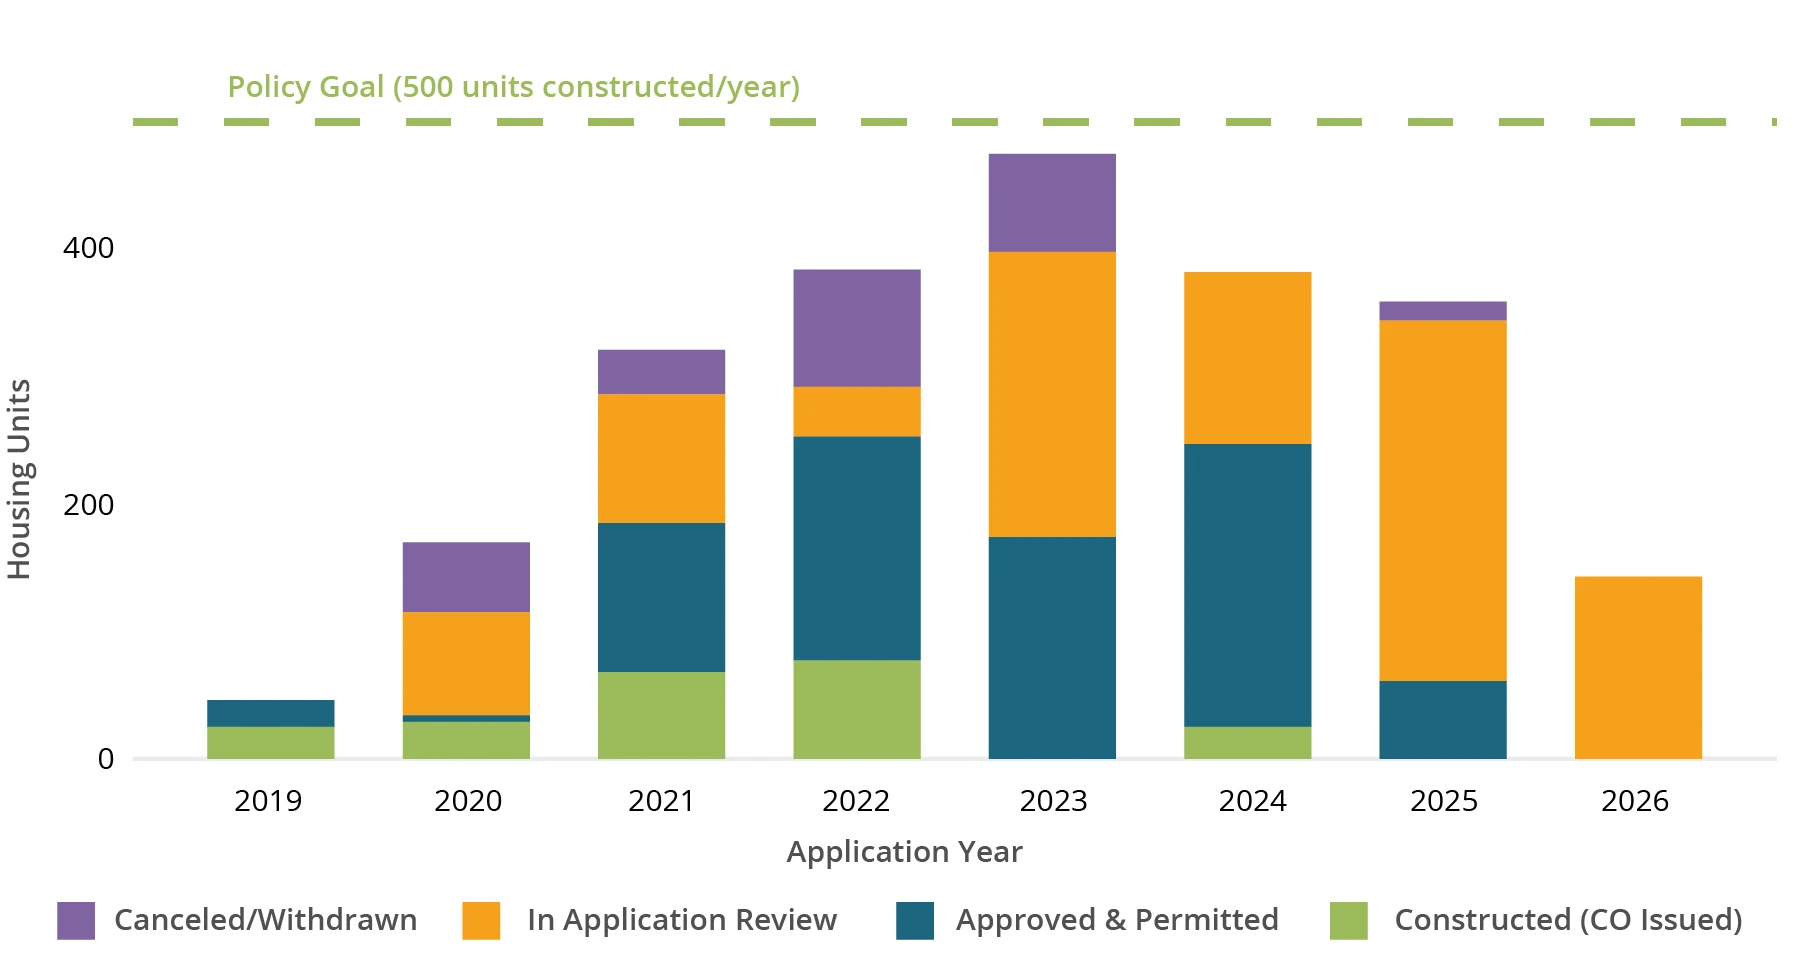
Note: 2026 figure reflects data through early September.
In practice, the program has appealed primarily to newer, smaller developers attempting to make use of marginal parcels near the primary urban core. Since 2019, 224 units have been constructed across 7 projects, out of a total of 85 projects and 2,280 units that have applied for permits (see Figure 1). In no year to date has the program reached its statutory target of 500 constructed units per year (Ordinance 19-8, Sec. 1). Applications peaked at 475 units in 2023, when Bill 7 represented over a quarter of all proposed multifamily units citywide, but that share has declined in subsequent years even as non-Bill 7 activity has held steady. Several permit applications, mostly from 2020-2023, have also been withdrawn, totaling 274 units.
Methodology
To understand the performance of the Bill 7 program to date, and to assess opportunities for reforming the program, UHERO developed the Housing Policy Simulator. The simulator is a simplified, interactive version of a pro forma, the spreadsheet model that real estate developers use to evaluate whether a project “pencils” (i.e., makes financial sense). The simulator allows users to modify project characteristics, permit pathways (Bill 7, standard zoning, etc.), regulatory limits, and market conditions, and see the effects of their changes on development feasibility in real-time, at both the project and city level. It was inspired by the Terner Center’s Housing Policy Dashboard, which helped planners and policymakers in Los Angeles test how changes in land use rules and other inputs could affect housing supply (Casey et al., 2022).
Figure 2: UHERO Housing Policy Simulator: Project View
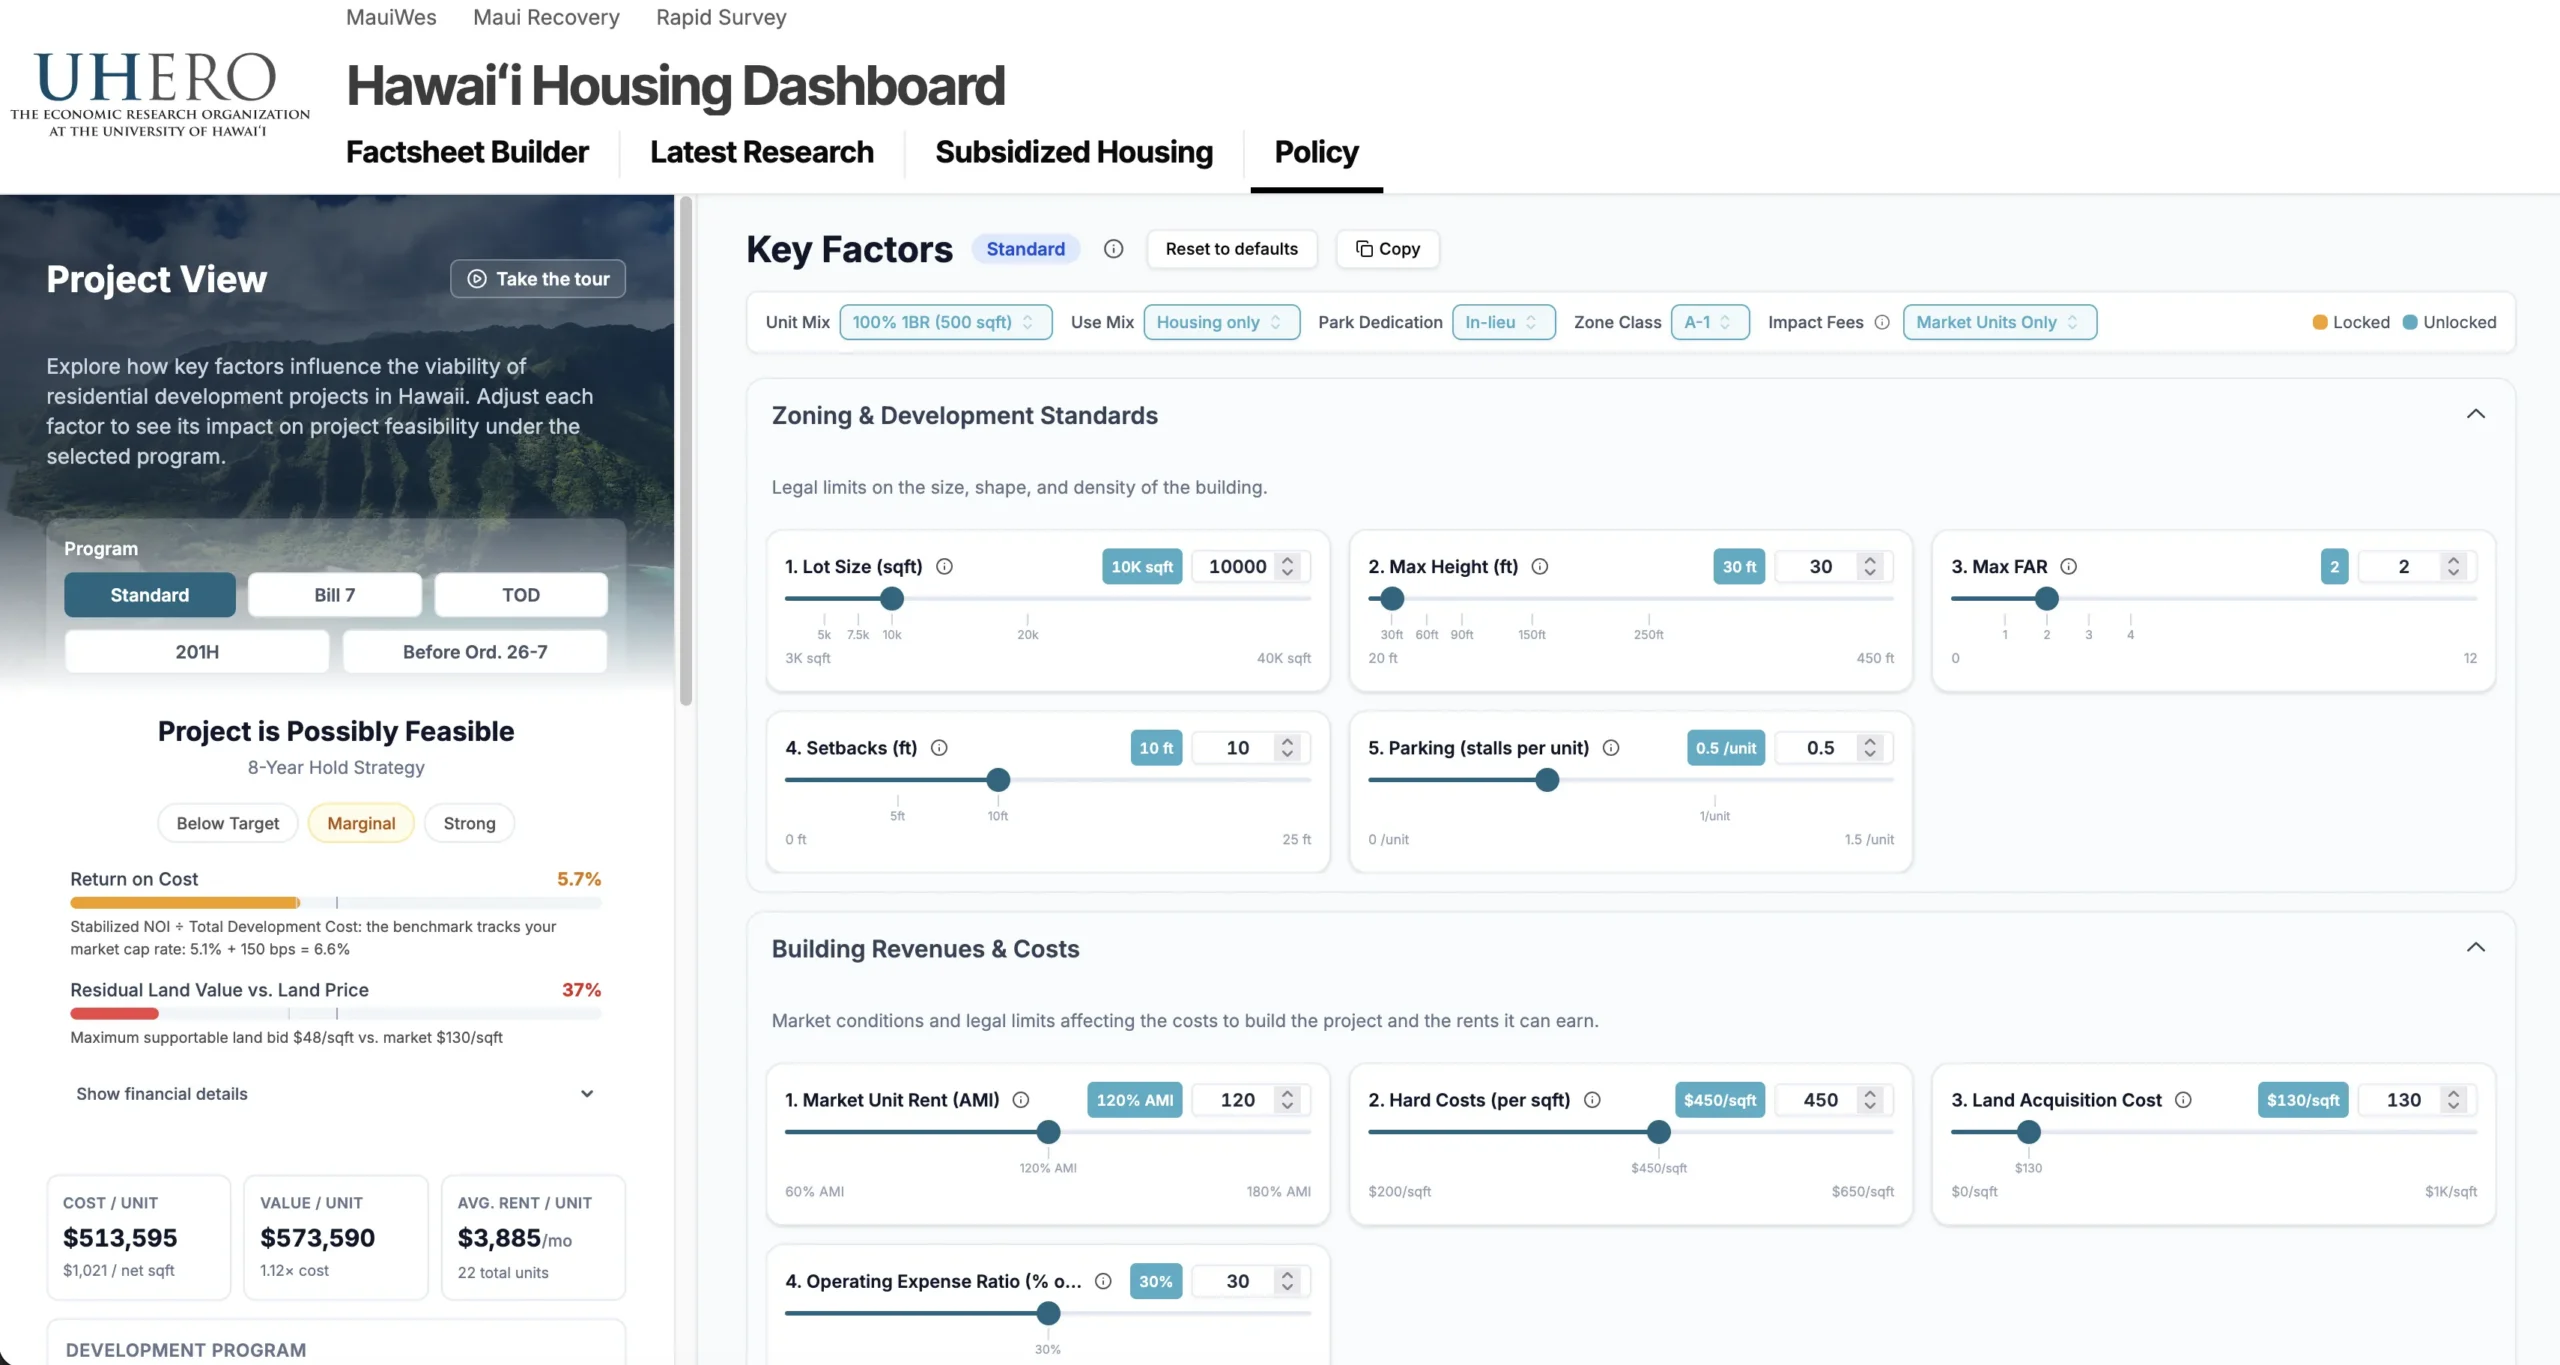
The simulator has two components. The first is the Project View, which simulates an individual project (Figure 2). Once users select project characteristics such as zoning district, unit mix, and lot size, the calculator computes standard development feasibility metrics, including return on cost and residual land value[2]. If the metrics meet industry standards for profitability, the model indicates that the project pencils. Otherwise, users can modify various aspects of the development process to try to improve feasibility: zoning and development standards, building revenues and costs, permit and construction times, and project financing. Default values for all parameters are based on actual law, as defined in the Revised Ordinances of Honolulu, and on extensive interviews and beta testing with real estate developers and commercial lenders active in Hawai’i. Calculations and outputs were validated for accuracy using financial information from actual projects constructed in Hawai’i.
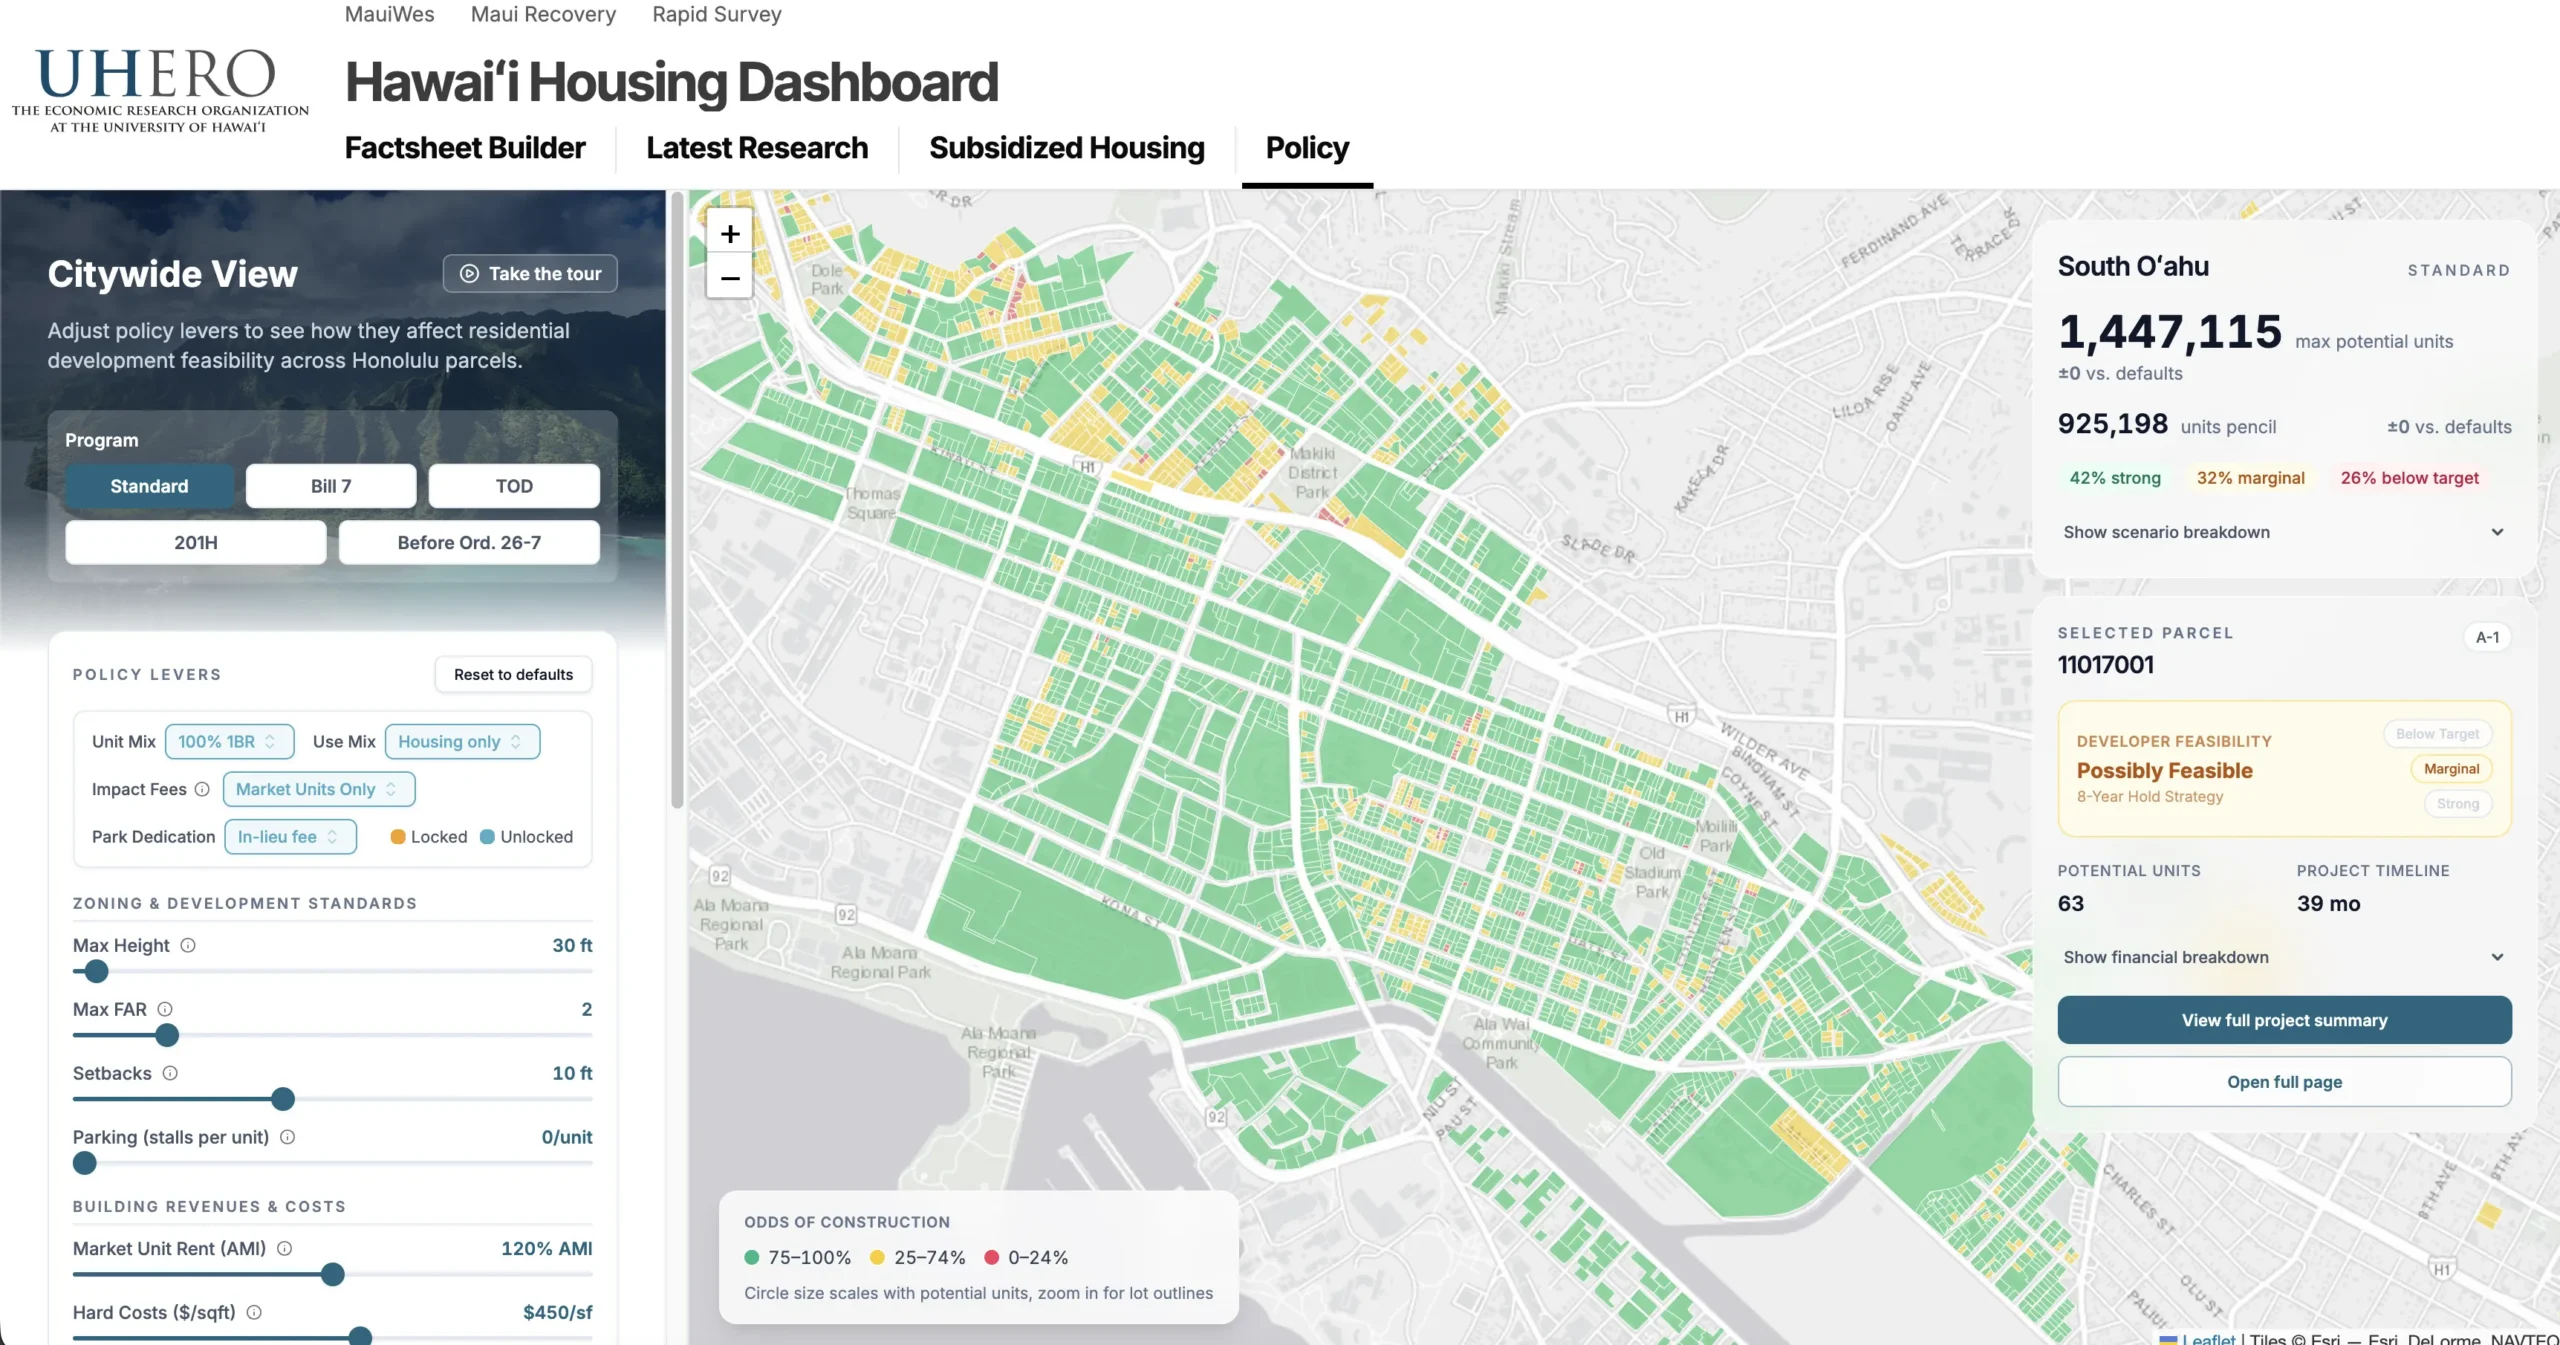
The second component is the Citywide View, which applies project view logic to each parcel in Honolulu using the City’s open GIS data. For each permit pathway, the Citywide View tests the maximum building envelopes and unit counts allowed; estimates development costs, revenues, and returns for each option; infers financial feasibility; and totals units across all feasible developments to project the total development potential of a given pathway. Both the Project View and the Citywide View in the Housing Policy Simulator can also be used to compare the effects of permit pathways on development feasibility.
Figure 3: UHERO Housing Policy Simulator: Citywide View
Using these tools, UHERO researchers contrast a hypothetical Bill 7 project with what could be built under standard zoning on the same lot. By gauging project size, density, revenues, and costs with and without Bill 7, we show the impact of the program on financial feasibility. Next, using data on actual lots in Honolulu, we estimate the total number of housing units that are both legally allowed and financially feasible on all eligible parcels, for a full accounting of the program’s potential. Finally, we simulate changes to regulatory requirements and market conditions and calculate the impact those changes would have on the development feasibility of Bill 7 projects. The results of this sensitivity analysis provide information about potential reforms that could spur additional construction under the program.
Findings
Bill 7 improves development feasibility over the standard pathway
Table 1 below shows a comparison of development feasibility between a realistic Bill 7 project, what standard zoning allows today, and what standard zoning allowed before 2026, on a typical 10,000 square foot parcel in an A-2 district. Ordinance 26-7, which took effect in April 2026, significantly relaxed the maximum FAR, maximum building area, and other development standards in all Apartment (A) and Apartment Mixed-Use (AMX) districts. The Standard (2019-2025) column is based on the development standards that prevailed from when the program was passed in 2019 until the recent amendments, and therefore represents the tradeoffs between permit pathways that developers faced for most of the program’s history. Ordinance 26-7 and its implications for the program are explored further in the Discussion section of this report.
Before Ord. 26-7, the hypothetical project under standard zoning was not profitable enough to justify its construction, returning just 5.0% on cost and a residual land value of only $4 per square foot. The same parcel developed under Bill 7 performs substantially better, with a return on cost of 6.2% and a residual land value comparable to market land prices. While this still does not reach the 6.6% threshold for construction under current market conditions, Bill 7 closes about three-quarters of the feasibility gap.
Table 1: Comparison of Development Feasibility, Bill 7 vs. Standard Zoning
| Bill 7 | Standard (2026) | Standard (2019-2025) | Difference (Bill 7 vs Pre-Ord. 26-7) | % Difference (Bill 7 vs Pre-Ord. 26-7) | |
| Buildable sq ft | 24,629 | 24,000 | 13,000 | +11,629 sf | +89.5% |
| Total units | 49 | 48 | 26 | +23 units | +88.5% |
| Parking stalls | 24 | 24 | 13 | +11 stalls | +84.6% |
| Return on Cost | 6.2% | 5.5% | 5.0% | +1.2pp | +24.3% |
| Residual Land Value | $201/sf ($2,007,953) | $17/sf ($168,384) | $4/sf ($38,177) | +$197/sf | n/a |
Note that in this comparison, all 3 pathways are modeled at 80% AMI to highlight how Bill 7 improves feasibility at a lower price point and to show the impact of the property tax exemption. We also price in the cost of constructing off-street parking equally for all pathways at the standard ROH §21-6.20 rate of one stall per 1,000 square feet of buildable area[3]. Although Bill 7 projects are legally exempt from off-street parking requirements, permit records and site visits confirm that they still build a considerable number of surface parking spaces on a per square foot basis. The pathways are modeled at a 40 foot height rather than the statutory 60 foot maximum. Our calculations, which are supported by discussion with developers and a review of Bill 7 permit applications, indicate that 40’ is often the economical height for Bill 7 projects–theheight that maximizes profitability. These three assumptions, while true to observed development patterns to date, may understate the potential performance of a Bill 7 project that makes more aggressive use of the program’s statutory limits, or particularly inventive use of land, labor, or materials. Charging higher rents would also improve the feasibility of all pathways as shown in a later sensitivity analysis.
Fee waivers now play an outsized role
The fee waivers granted to our hypothetical Bill 7 project save nearly $1M in soft costs today–nearly $20,000 per unit. Since Ordinance 26-7 equalized density between the Bill 7 and standard pathways, fee waivers have become the largest remaining regulatory benefit. Under ROH §§18-6.5(i), 22-7.3(j), and 43-10.8, any market units must pay fees in full–only income-restricted units are exempted. However, according to official program data, nearly all Bill 7 projects are 100% income-restricted at 80% AMI, meaning that in practice the city waives fees nearly in full (98%). As Table 2 reveals, park dedication fee and wastewater system facility charges account for most of the difference. Overall, fee waivers represent a cost savings of 5.2% of the hypothetical Bill 7 project’s $18.4 million total development costs, which equates to a gain of $81 per square foot of residual land value. Essentially, money not spent on City fees is available to pay for land instead.
Table 2: Comparison of Soft Costs, Bill 7 vs. Standard Zoning
| Cost category | Bill 7 | Standard (2026) | Standard (2019-2025) | Difference (Bill 7 vs Standard 2026) |
|---|---|---|---|---|
| Fees identical under all pathways[4] | $3,390 | $3,390 | $3,390 | $0 |
| Building Permit | $0 | $119,684 | $64,829 | -$119,684 |
| Plan Review | $0 | $11,968 | $6,483 | -$11,968 |
| Park Dedication (in-lieu) | $0 | $480,200 | $260,200 | -$480,200 |
| Wastewater System Facility Charge | $0 | $253,310 | $137,210 | -$253,310 |
| Water System Facility Charge + New Meter | $0 | $85,583 | $58,498 | -$85,583 |
| Utilities (Trench + Connection) | $12,005 | $11,760 | $6,370 | $245 |
| Total soft costs | $15,395 | $965,896 | $536,979 | -$950,501 |
| Soft costs per unit | $314 | $20,123 | $20,653 | -$19,809 |
Bill 7 substantially increases both legal and feasible unit counts
The previous section presented a comparison of Bill 7 and standard zoning at the parcel level. This section compares them citywide. Table 3 shows the results of testing development feasibility for realistic Bill 7 and standard zoning projects across all 7,855 parcels eligible for Bill 7 development. Bill 7 nearly doubles the number of units legally allowed on these parcels from 117,595 to 211,813, as its 4.0 FAR replaces the lot-scaled standard that left smaller parcels with little buildable footprint after their required setbacks. Ordinance 26-7 has since gone further, with flat FARs and no per-unit cap. Now standard zoning legally allows 239,250 units on the same parcels, more than Bill 7 itself. However, more Bill 7 units are close to feasibility, and at least 80% of these must be income-restricted, not market-rate, by law. These results underscore the continued advantage of the program relative to the standard permit pathway.
Table 3: Comparison of City-wide Capacity and Feasibility, Bill 7 vs. Standard Zoning
| Metric | Bill 7 scenario | Standard (2026) | Standard (2019-25) | Difference (Bill 7 vs old Standard) | Interpretation |
| Median project size (units) | 24 | 25 | 8 | 16 units | Pre-Ord. 26-7 projects on the same lots were 1/3 the size. |
| Maximum legal units | 211,813 | 239,250 | 117,595 | 94,218 | Both Bill 7 and Ord. 26-7 greatly expanded the theoretical buildout on these parcels. |
| Parcels with ROC ≥ 5.6% and positive RLV | 6,289 (80.1%) | 1,364 (17.4%) | 74 (0.9%) | 79.1pp | Bill 7 nears viability on ~4/5 of parcels. |
| Units with ROC ≥ 5.6% and positive RLV | 198,758 (93.8%) | 73,100 (30.6%) | 6,501 (5.5%) | 192,257 units | Bill 7 increased pre-Ord. 26-7 units 31x. |
| Near-feasible parcels[5] | 3,658 (46.6%) | 0 | 0 | 46.6pp | Only Bill 7 projects can pay $200/sf for land. |
| Near-feasible units | 143,574 (67.8%) | 0 | 0 | 67.8pp | Projects with more units can support higher land prices. |
The critical distinction lies in the number of units that are close to financially feasible under current conditions. Before Ordinance 26-7 was enacted, only 74 of the 7,855 simulated projects (0.9%), representing 6,501 total units, would have reached a return on cost of 5.6% with a positive residual land value. Notably, all of those projects were located on BMX lots. Bill 7 projects, by comparison, meet this criterion on 6,289 unique parcels, for a total of 198,758 units–a 31-fold increase. Post-Ord. 26-7 zoning falls in between at 1,364 parcels and 73,100 units.
Only Bill 7 projects clear the near-feasibility test. Applying the $200/sqft RLV and 6.1% ROC screen leaves 3,658 parcels and 143,574 total units as near-feasible, while no standard zoning project under either rule can pay this amount for land; the most any can pay is about $37 per square foot. Standard (2026) projects are similar in size to Bill 7 projects, and even surpass Bill 7’s theoretical maximum units. However, the scenario sets market rents at 80% AMI, thus standard projects earn no more rent than Bill 7 projects despite having no income restriction[6].
Standard projects also receive none of Bill 7’s waivers, property tax exemptions, or construction grants, which leaves them with far less money for land after all profits and costs are covered. While the Bill 7 policy incentives contribute significantly to what a developer can pay for land, about a third of units theoretically possible under the Bill 7 program miss the near-feasible threshold. These findings are also sensitive to the $200/sqft threshold; no simulated projects under any pathway clears $220/sqft.
How program parameters affect feasibility
The Housing Policy Simulator enables comparisons not only between different permitting pathways as they exist today, but also between actual and potential versions of those pathways. It is possible, then, to estimate how changing regulations such as FAR, height, or grant amounts would affect development feasibility under Bill 7, and to identify which would have the greatest impact. Table 4 shows the results of a sensitivity analysis that tests policy levers within the City’s control, one at a time, against the baseline Bill 7 project from Table 1. For illustrative purposes, the table also includes select project characteristics and market constraints that affect feasibility but are outside of the City’s direct control.
The table reports two measures of feasibility that developers use to initially evaluate a project. Return on cost asks whether a building is worth constructing: it compares the income the finished project earns each year with what it costs to build, and lenders and investors generally look for about 6.6 percent before committing. Residual land value asks whether a developer can afford the site: it is the most a developer could pay for the land and still meet investors’ return requirements. A project needs both to move forward.
The two measures do not always move together. Return on cost is a ratio of annual income to total cost. It grows when the project is more profitable per unit, but not necessarily with project size. Residual land value rises with both the size and the profitability of the project. It also rises when money arrives sooner, because investors who expect high returns place more value on a dollar received today than on one received years from now.
Table 4: Sensitivity Analysis of Bill 7 Program Parameters on Development Feasibility, in Descending Order by Effect on Return on Cost
| Parameter | Default Value | Test Value | Projected Return on Cost (%) | Projected RLV per sqft ($) |
|---|---|---|---|---|
| Baseline[7] | 49 units | – | 6.2 | 201 |
| Actual rent (as % AMI) | 80% | 100% | 7.4 (+1.2) | 503 (+302) |
| Grant Amount (Up-front)[8] | n/a | $50,000 | 7 (+0.8) | 401 (+200) |
| Unit Mix | 50% studio (300 sq ft), 50% 1BR (500 sq ft) | 75% studio, 25% 1BR | 6.9 (+0.7) | 351 (+150) |
| Actual rent (as % AMI) | 80% | 90% | 6.7 (+0.5) | 316 (+115) |
| Density bonus: Height |
40 ft | 75 ft | 6.5 (+0.3) (76 units) | 323 (+122) |
| Unit Factor[9] | 200 | 130 | ||
| FAR | 4 | 5 | ||
| Grant Amount (Pre-construction) | $50,000/unit | $60,000/unit | 6.3 → 6.5 | 208 → 247 |
| Grant Amount (Post-construction) | $12,000/unit | $24,000/unit | 6.4 (+0.2) | 246 (+45) |
| Lot Size | 10,000 sf | 40,000 sf (200 units) | 6.3 (+0.1) | 209 (+8) |
| Grant Timing[10] | Post-construction ($50,000 per unit) | Pre-construction ($50,000 per unit) | 7.0 → 6.3 | 343 → 208 |
| Property Tax Exemption | 15 year exemption on improvements | None | 6.0 (-0.2) | 139 (-62) |
| Fee Waivers | As in Table 2 | None | 5.9 (-0.3) | 120 (-81) |
| Hard Costs | $450/sf | $500/sf | 5.7 (-0.5) | 72 (-129) |
“Parameter” is the lever being tested, “Default Value” is the current legal limit or the option used in the baseline project, and “Test Value” is a simulated change from the default. “Projected Return on Cost” and “Projected RLV” are the project’s return on cost and its residual land value per square foot of lot with the test applied. Figures in parentheses are changes from the baseline, in percentage points for return on cost and in dollars for RLV. Where a row shows two values separated by an arrow, the first applies at the default value and the second at the test value.
The baseline scenario meets the near-feasibility thresholds established in Table 3, but not the 6.6% return on cost that investors demand. Land eligible for Bill 7 has a median assessed value of $170 per square foot[11], and recorded sales of Bill 7 project sites in urban Honolulu since 2020 show an even higher median cost of $212/sqft[12]. While some Bill 7 developers report creative land arrangements that reduce upfront land costs, such as landowners joining the project as equity partners, or projects on publicly owned land with a nominal ground lease, this analysis assumes that projects would need to pay close to market land prices to be truly, consistently feasible.
The density bonus combines three changes that together let a project fit more units on the same lot: a 75-foot height limit, a unit factor of 130 (see footnote 9), and an FAR of 5.0. Tested together, they raise the baseline project from 49 to 76 units–55 percent more–on the same 10,000-square-foot parcel. The changes are tested as a package because each limit effectively constrains the same thing: building area. Under current rules, the unit factor caps a 10,000-square-foot lot at 50 units, about what fits in the 40-foot building that our calculations and Bill 7 permit applications suggest is most profitable. That is why many Bill 7 projects stop well short of the 60-foot height limit: building taller adds construction costs, such as elevators, but no additional units. Raising the height limit without also loosening the unit cap implied by FAR and Unit Factor, therefore, would have little or no impact.
The density bonus raises return on cost modestly, slightly more than the effect of doubling the post-construction grant. Spreading the same land cost over more units lowers the cost per unit by about $15,000, but residual land value rises by 61 percent due to many more revenue-producing units. That is enough to pay roughly the land prices that approved Bill 7 projects have paid recently without increasing the City’s subsidy. Note that these results assume that building to 75 feet does not raise construction costs per square foot. If taller buildings require heavier and more expensive construction methods, the gains would be smaller.
Raising the maximum lot size has a different effect. A 40,000-square-foot lot supports a 200-unit project, but its economics per square foot barely change. Larger lots make bigger projects possible, but not more profitable. The main benefit of raising the limit would be to increase the number of lots eligible for Bill 7 development, which would increase the potential impact of the program. Similarly, Bill 7 does not currently apply to Business (B-1 and B-2) districts, but expanding eligibility to include them could potentially stimulate construction of relatively affordable rental housing in more expensive submarkets and more directly along transit corridors[13].
Unit mix and rent levels have among the largest effects on both measures, but are outside of the City’s direct control. Smaller units increase hard costs on a per square foot basis (more doors, walls, windows, etc.), but compensate for this by drawing higher rents on a per square foot basis. Two studios, for example, earn more in revenue than one two-bedroom unit, even if the square footage is the same. In theory, increasing the AMI that units rent for would also have a considerable effect on building revenues, and therefore on feasibility; however developers are in practice constrained more by comparable rents in the surrounding area than the statutory maximum.
Financial incentives raise both return on cost and residual land value, but by how much depends on their size, their conditions, and when they are paid. The pre-construction subsidy is larger, at $50,000 per unit, but it comes with two conditions. It can be used only to pay prevailing wages, which raise labor costs, and it is paid out in installments during construction, after the building permit is issued. We estimate prevailing wages add about 45% to on-site labor costs, or about $1.5 million on the baseline project[14]. With those conditions, the $50,000 subsidy marginally raises return on cost to 6.3 percent and residual land value to $208 per square foot, far less than a $50,000-per-unit post-construction grant would (7 percent and $343). A hypothetical $50,000 grant with no wage requirement, paid up front when the developer acquired the land, would raise residual land value still further, to $401 per square foot. Money received sooner is worth more to investors who expect high returns, but paying up front also means the City would commit funds before a project is built, exposing it to some development risk.
The 15-year property tax exemption on improvements matters more than its size suggests. Without it, the baseline project’s annual property tax would rise from about $7,000 to about $55,000, lowering return on cost from 6.2 to 6.0 percent and residual land value from $201 to $139 per square foot. The added $48,000 a year is small relative to the project’s $18.4 million development cost, but it comes directly out of net operating income, which lenders use to size the permanent loan. A smaller loan leaves a gap the developer must fill with more expensive equity.
Finally, the margins are thin enough that small headwinds or design decisions can erase the project’s land value entirely. An 11 percent increase in hard costs would lower return on cost to 5.7 percent and cut residual land value to $72 per square foot, well below what land in these districts sells for. Taken together, these results show that the levers within the City’s control work in different ways. Larger grants and the density bonus raise both return on cost and residual land value. Raising the maximum lot size makes projects, and the pool of eligible parcels, larger without making them more profitable. And of the City levers tested, only the density bonus improves both measures substantially without increasing the City’s cost per unit.
Discussion
The development environment has worsened considerably since Bill 7 passed
Since the enactment of Chapter 32 in 2019, financing and construction costs have increased considerably. The prime lending rate has increased from 5.5% to 6.75% (and reached a high of 8.5% in 2023), while Honolulu construction costs are up roughly 30%. Mounting costs help to explain the steady decline in new permit applications over the last 3 years and the withdrawal of several applications. Projects that were narrowly feasible when the application was submitted may have become infeasible by the time they were approved.
This aligns with national surveys of developers and construction professionals. In a March 2024 survey conducted by the National Multifamily Housing Council, economic infeasibility was the most cited reason for delayed starts (74%), followed by construction financing availability (68%) and broader economic uncertainty (62%). The National Association of Home Builders’ 2024 Multifamily Market Survey found that 80% of builders and developers rated interest rates and construction costs as “serious” or “very serious” impediments to starting new multifamily construction. Accelerating construction of Bill 7 projects–or affordable housing more generally–would require a reversal of these trends, or new policy proposals to mitigate their effects.
Permit delays have a significant impact on feasibility, but addressing them requires more study
Permitting delays extend project completion times, exposing projects to rising construction costs and changing interest rates. Honolulu is slow to permit housing by national standards. A recent study of 60 U.S. cities estimates that a standardized 20-unit apartment building submitted between 2015 and 2019 would take about 1.3 years to be issued a permit in Honolulu, against a 0.7-year average across cities and just two months in the fastest (D’Amico, Soltas, and Wang, 2026). Only five of the 43 cities with reliable multifamily estimates were slower. In the same study, a standardized single-family home would take about eight months to permit in Honolulu, roughly twice the cross-city average and more than three times the median. The study adjusts for differences in project size and neighborhood and includes both the time that agencies spend reviewing plans and the time applicants spend revising them.
Recall from Table 3 that nearly half of modeled Bill 7 projects, and two thirds of potential units, are near-feasible under current conditions, implying that the profit margins of actual Bill 7 projects could be narrow. The smaller the margins on a project, the more sensitive it is to disruptions of any kind, including permit delays. While an application is in review, the developer pays land control and predevelopment expenses with no income while construction costs continue to appreciate. Each month of delay costs our simulated project roughly $74,000, which adds 0.4 percent to its cost and subtracts $30,000 from its residual land value. For actual projects, prolonged delays could also reduce lender and investor confidence, making follow-on financing more difficult to acquire.
Bill 7 established a firm ceiling of 90 days for permit processing:
Upon acceptance of a complete application for a building permit to construct an affordable rental housing project, the building official shall approve or disapprove the application within 90 calendar days. If the building official fails [sic] approve or disapprove a building permit application for an affordable rental housing project within 90 days after acceptance of a complete application, the building permit application will be deemed approved. (ROH § 32-1.5(b))
That 90-day target has never been met, and developers report not using the automatic-approval provision because of legal uncertainty associated with building to unreviewed plans. Of the 19 Bill 7 permits issued before July 2025, none was ready for pickup within 90 days of DPP accepting the application; the median was 531 days. Nor is this a matter of developers waiting for better market conditions before collecting their permits. Once ready, Bill 7 permits waited a median of 11 days for pickup, about 2 percent of total permit time.
Although Bill 7 permits have been slow, there are signs of progress. Before plan review begins, applications wait in what DPP’s records call a pre-submission queue for DPP’s completeness check. Bill 7 applications filed in 2021–2022 waited a median of 73 days for this check; those filed in 2024–2025 waited only 15 days. And once plans reach a reviewer, individual reviews are quick: nearly half close the day they are received, and three-quarters within a week. Average turnaround has fallen from about nine days per review in 2022–2023 to about five in 2024–2025.
To help attribute the remaining time, we divide each project’s plan-review period into three categories, using permit records available through July 2025 (City and County of Honolulu Department of Planning and Permitting, 2025):
- DPP time: days when at least one DPP review was open, whether or not another agency was also reviewing.
- Other agency time: days when only another agency’s review was open, such as the Fire Department, the Board of Water Supply, or state health and historic preservation reviewers.
- Developer time: days when no review was open.
We include only active projects, excluding canceled applications and inactive ones[15]. Averaged across application cohorts, active projects spent 469 days with the applicant, 137 days with DPP, and 30 days with other agencies. Projects submitted in 2024 average just 84 days of DPP review, though that figure is biased downward because some projects are still in review (Figure 4).
Figure 4: Bill 7 Permit Time by Responsible Party
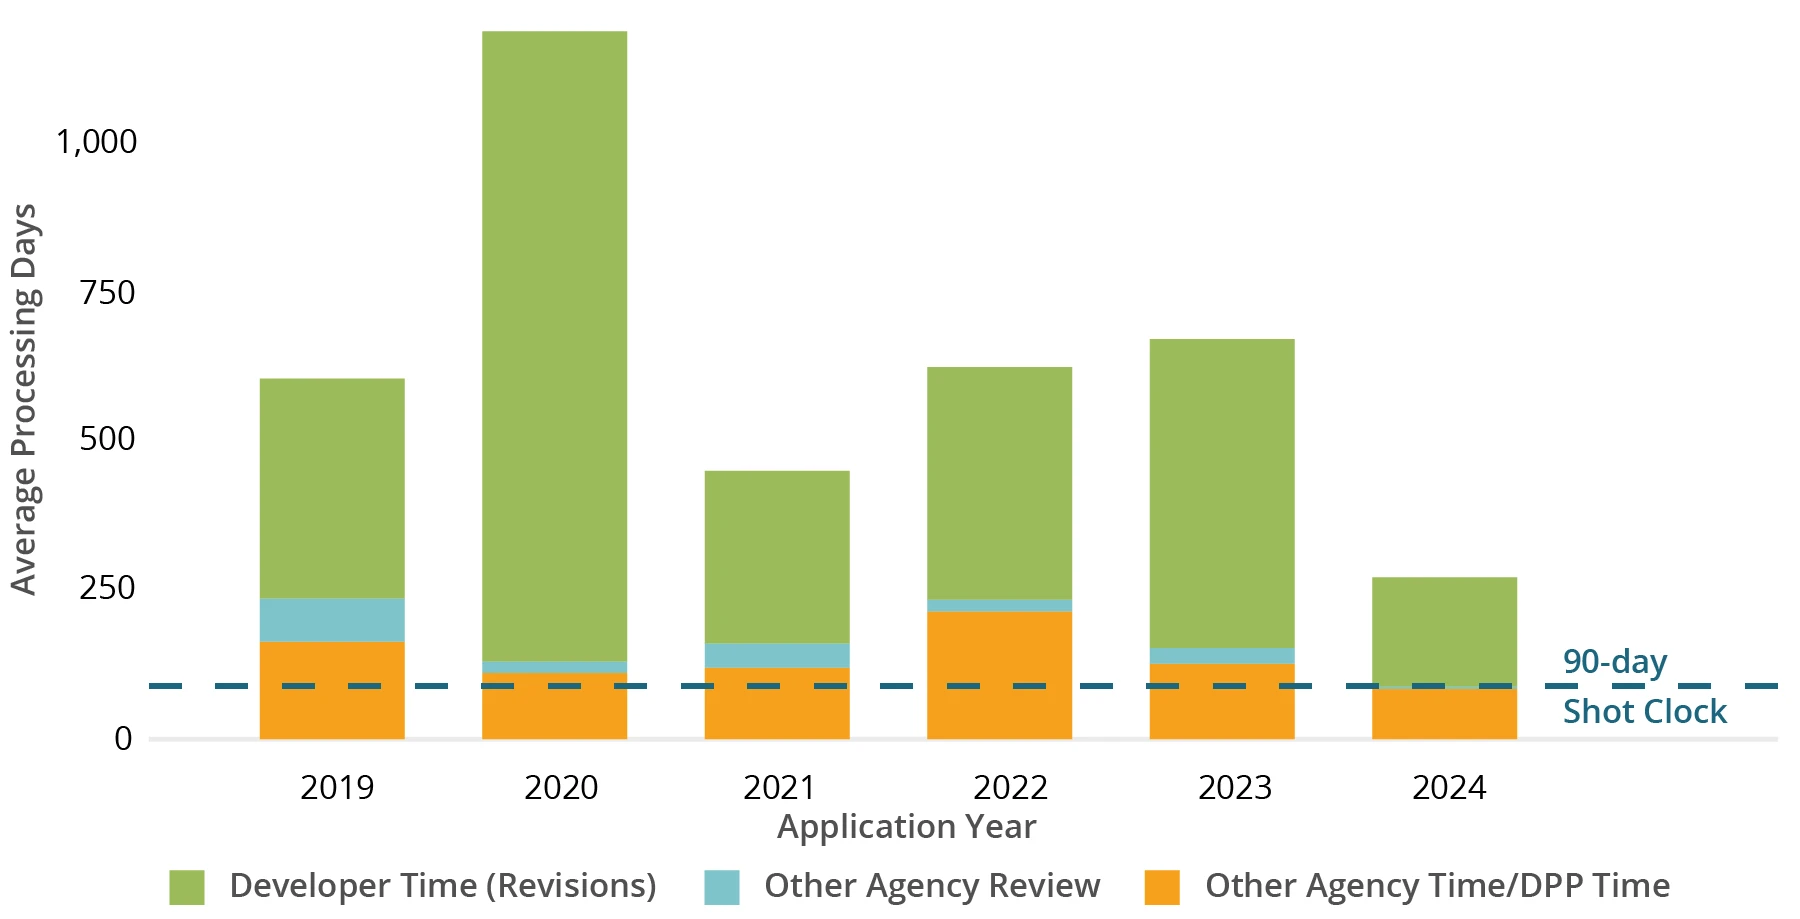
This breakdown comes with a few caveats. “Developer time” may include time spent securing approvals or exemptions that are not tracked in DPP’s permit system, such as state environmental review under HRS Chapter 343. Public building permit records do not record when the applicant resubmitted plans, so any day with no review open is counted as developer time, which may include time that plans spend waiting to be routed to the next reviewer. Finally, some Bill 7 projects proceed under Special Assignment Inspection, which allows construction before a permit is issued and may reduce a developer’s urgency to complete permitting, thereby extending developer time.
A key driver of total permitting time is the number of review rounds. Each permit is reviewed by multiple disciplines, within DPP and in other agencies such as the Fire Department and Board of Water Supply. Each discipline may review a project multiple times, including after other disciplines have requested changes. For the median Bill 7 project, its slowest discipline required five rounds of review, and some projects needed ten or more. Mechanical and zoning reviews averaged more than four rounds before their first approval, and more than half of reviews in the fourth round or later still returned comments.
DPP reports that Bill 7 projects average more than seven review cycles, against three to six for typical commercial projects, and attributes this mainly to application quality (Takeuchi Apuna, 2026). We can reproduce DPP’s estimates, but the count depends on how a cycle is defined[16]. And the data cannot show whether comments in later rounds respond to earlier ones or raise entirely new issues. In 17 of 59 Bill 7 projects with detailed permit data, a discipline returned comments after it had already approved the plans; in 13 of them, after an unconditional approval.
Better applications could help, and DPP’s expansion of its CivCheck pre-submission guidance to larger housing projects is aimed at exactly that. But application quality may not fully explain high round counts or reviews reopened after approval, and the data available for this study cannot settle the question. To help diagnose permit delays, DPP could review the program for the number of rounds by discipline, the categories of comments raised in each round, and whether each comment is new or carried over from a previous round. Building permit and pre-clearance data from the new DPP systems would also allow for more current estimates of permit times.
Resolving permit delays could significantly improve Bill 7 feasibility. Reducing average review time from 167 to 90 days would save the simulated project about $184,000. Cutting total permitting time in half would raise its return on cost to 6.3 percent and add $284,000 to its residual land value. Because rounds drive total time, the largest gains are likely to come from fewer rounds, rather than from faster turnaround within each round, where DPP has already improved.
The relative value of the Bill 7 program has diminished over time
Since its enactment as Ordinance 19-8 in 2019, the Bill 7 program has been amended several times, and its expiration date extended from May 2024 to June 2030. The most significant changes have been financial. Ordinance 21-12 established post-construction cash grants, later increased by Ordinance 24-23 to $12,000 per affordable unit. Ordinance 25-19 added a pre-construction subsidy of up to $50,000 per unit to cover prevailing wage costs. Together, these grants represent a shift in the program’s value proposition, moving it from a primarily regulatory tool toward one that also provides direct financial support.
At the same time, several of the regulatory advantages that once made Bill 7 distinctive have since become available to all developers through broader changes to zoning and building codes. When Bill 7 passed in 2019, its parking exemption and higher density limits were meaningful departures from standard zoning. Since then, off-street parking requirements have been eliminated in the Primary Urban Center and within half a mile of rail transit stations under Ordinance 20-41, covering most of the areas where Bill 7 projects are concentrated. Most recently, Ordinance 26-7 (City and County of Honolulu, 2026b) reduced minimum lot sizes and replaced lot-size-scaled FAR tables with flat FAR maximums across all apartment zoning districts, making buildable square footage under standard zoning comparable to Bill 7 density bonuses (see Table 5). As a result, much of what once set Bill 7 apart is now also available to projects without income limitations in the same areas. Relative to pre-Ord. 26-7 conditions, the feasibility gap between standard zoning after Ord. 26-7 and Bill 7 is 39% smaller, falling from 122 basis points to 74, representing the sustained value of Bill 7 fee waivers, subsidies, and property tax exemptions.
Table 5: Comparison of Development Feasibility Before and After Ord. 26-7
| Bill 7 | New Standard (after Ord. 26-7) | Old Standard (before Ord. 26-7) | |
| Buildable sq ft | 24,629 | 24,000 | 13,000 |
| Total units | 49 | 48 | 26 |
| Soft cost per unit (incl. construction management) | $8,717 | $28,503 | $29,033 |
| Return on Cost | 6.2% | 5.5% | 5.0% |
| Residual Land Value | $2,007,953 ($201/sf) | $168,384 ($17/sf) | $38,177 ($4/sf) |
Bill 7 contributes to other policy goals
Beyond adding units, Bill 7 advances the city’s transportation and land use goals because of where these projects are built. The literature on workforce housing is consistent on this point: the public value of affordable housing is enhanced with proximity to jobs and transit, since workers located near employment opportunities see shorter unemployment spells, and access to affordable housing near jobs is associated with better labor market outcomes including income and job quality (Bertaud, 2015; Andersson et al., 2018; Dauth, Mense, and Wrede, 2024). A shortage of affordable housing near jobs, meanwhile, pushes lower and middle wage workers into longer commutes (Blumenberg and Siddiq, 2023). And at the metro scale, restricting housing supply in high access locations misallocates workers and reduces overall economic output (Hsieh and Moretti, 2019). Infill workforce housing serves the dual purpose of housing people affordably while placing them where they can reach jobs, schools, services, and transit without relying on a car.
Bill 7, by design, currently applies only to small parcels in A, AMX, and BMX districts. These parcels are concentrated in denser, more transit-served parts of the island. Every project in the Bill 7 portfolio sits within a quarter mile of a bus stop, and 6 are within a half-mile of a current or planned Skyline rail station. The pipeline is trending even more transit-oriented over time, with projects not yet built sited closer to transit on average than those already completed.
Census tract-level transportation indicators from the 2020- 2024 American Community Survey for neighborhoods with Bill 7 projects confirm local differences in travel behavior, not just proximity on a map: residents drive alone to work at meaningfully lower rates than the county overall, roughly 52 percent versus 63 percent, while transit use and walking to work are roughly 1.7–1.8 times the countywide average (U.S. Census Bureau, 2024a-f). Households in these tracts are also considerably less likely to own a car, with zero vehicle households nearly twice as common as the county benchmark, and commutes tend to be shorter, with about seven in ten workers reaching their jobs in under 30 minutes compared with roughly six in ten countywide. This pattern is not driven by a handful of unusually urban sites: over 90 percent of affordable units sit in tracts with higher than average shares of zero and one vehicle households, and more than 80 percent are in tracts with above average transit use.
While these figures describe neighborhood conditions rather than the travel habits of residents in Bill 7 projects specifically, the evidence indicates that Bill 7 encourages housing production in locations that are less car dependent than the island norm, consistent with lower vehicle miles traveled per household than a comparable unit built in a more car-oriented part of O‘ahu. Bill 7 is not only adding affordable units; it is adding them in areas where residents rely less on cars, consistent with the City’s broader land-use and transportation objectives.
Conclusion
Bill 7 has increased both the legal development capacity and estimated financial feasibility of housing on eligible parcels. Compared with the zoning rules that prevailed before Ordinance 26-7, the program nearly doubled the typical project size in the simulation and increased the number of units with an ROC of at least 5.6% and a positive RLV from 6,501 to 198,758. Moreover, only Bill 7 projects can afford to pay comparable market land prices, with 143,574 units or 67.8% of Bill 7’s maximum legal housing production, clearing the land value test. At the same time, actual production has remained well below the program’s statutory goal: 224 units have been completed since 2019, while many approved or pending projects have not yet begun construction.
The context in which the program operates has also changed. Higher financing and construction costs have reduced development feasibility generally, while recent changes to base zoning have narrowed several of the regulatory differences between Bill 7 and conventional development. In the representative project modeled in this report, the return-on-cost advantage of Bill 7 over standard zoning fell from 122 basis points under the pre-2026 rules to 74 basis points after Ordinance 26-7. Permitting time remains another relevant factor: active projects have averaged 167 days in agency review, compared with Chapter 32’s 90-day goal, with applicant revisions contributing even more time.
The sensitivity analysis illustrates the relative effects of different policy variables without identifying a single preferred approach. Together, changes to height, FAR, and the unit cap that raise unit capacity have modest effects on modeled returns but large effects on land value. Changes to rent levels and unit mix have among the largest effects on returns, but are less amenable to direct policy change. Changes to where projects can happen, as with increasing maximum lot sizes or adding new zones, can expand the range of the program but do not significantly affect feasibility. Financial incentives raise returns in proportion to their size, while their timing affects land value. An up-front, unconditional $50,000 grant per affordable unit would raise residual land value from $343 to $401 per square foot, increasing the grant’s contribution by 31% compared to the same grant provided after construction. Conditions also play an important role: prevailing wage premiums currently outweigh the value of receiving the grant earlier.
The results of this study suggest several useful metrics for monitoring Chapter 32 in the future, many of which anyone can calculate using the Housing Policy Simulator. Policymakers can track completed units and project starts alongside applications and approvals; compare return on cost and residual land value under Bill 7 and standard zoning; monitor the number and share of units that approach feasibility; measure agency and applicant permitting time separately, along with the number of review rounds; and compare the amount and duration of affordability produced under different incentive structures. Because Bill 7 projects are concentrated in relatively transit-accessible, less car-dependent neighborhoods, their location may also be relevant when assessing the program against broader land-use and transportation objectives.
The central finding is therefore not that one particular reform is necessary, but that Bill 7’s performance depends on the interaction between its incentives, underlying zoning, permitting conditions, and broader market conditions. As those factors change, the same program provisions can have different effects. The measures presented in this report provide a basis for comparing alternative program designs and for assessing whether future changes increase housing production, affordability, development feasibility, or other objectives established by policymakers.
Works Cited
Andersson, F., Haltiwanger, J. C., Kutzbach, M. J., Pollakowski, H. O., & Weinberg, D. H. (2018). Job displacement and the duration of joblessness: The role of spatial mismatch. Review of Economics and Statistics, 100(2), 203-218.
Bertaud, A. (2015). Cities as labour markets. International Transport Forum.
Blumenberg, E., & Siddiq, F. (2023). Commute distance and jobs-housing fit. Transportation, 50(3), 869–891.
Casey, A., Metcalf, B., Garcia, D., Tiu, H. R., & Romem, I. (2022, October). Modeling new housing supply in Los Angeles: Simulations from the Terner Housing Policy Dashboard. Terner Center for Housing Innovation.
City and County of Honolulu. (n.d.). Chapter 8: Real property tax. Revised Ordinances of Honolulu.
City and County of Honolulu. (n.d.). Chapter 16, Article 1: Adoption of the Hawaii State Building Code and Hawaii State Residential Code. Revised Ordinances of Honolulu.
City and County of Honolulu. (n.d.). Chapter 18: Fees and permits for building, electrical, plumbing, and sidewalk codes. Revised Ordinances of Honolulu.
City and County of Honolulu. (n.d.). Chapter 22: Subdivision of land. Revised Ordinances of Honolulu.
City and County of Honolulu. (n.d.). Chapter 32: Affordable rental housing. Revised Ordinances of Honolulu.
City and County of Honolulu. (n.d.). Chapter 43: Sewers, drainage, and cesspools. Revised Ordinances of Honolulu.
City and County of Honolulu. (2019). Ordinance 19-8: An ordinance relating to affordable rental housing (Bill 7). Honolulu City Council.
City and County of Honolulu. (2020). Ordinance 20-41: Relating to off-street parking and loading. Honolulu City Council.
City and County of Honolulu. (2021). Ordinance 21-12: Relating to grants incentivizing the construction of affordable rental housing. Honolulu City Council.
City and County of Honolulu. (2024). Ordinance 24-23: Relating to incentives for the construction of affordable rental housing. Honolulu City Council.
City and County of Honolulu. (2025). Ordinance 25-19: Relating to pre-construction financing for affordable rental housing. Honolulu City Council.
City and County of Honolulu. (2026a). Bill 18 (2026), CD1: Relating to affordable housing [Committee draft]. Honolulu City Council.
City and County of Honolulu. (2026b). Ordinance 26-7: Relating to development standards in the apartment and apartment mixed-use districts (Bill 6). Honolulu City Council.
City and County of Honolulu, Department of Budget and Fiscal Services, Real Property Assessment Division. (2025). City and County of Honolulu real property tax valuation for fiscal year 2025–2026. https://realproperty.honolulu.gov/media/zjth3lk0/state-report-fy26-final_honolulu.pdf
City and County of Honolulu Department of Planning and Permitting. (n.d.). Affordable housing. https://www.honolulu.gov/dpp/planning/affordable-housing/
City and County of Honolulu Department of Planning and Permitting. (2025). Building permits – January 1, 2005 through June 30, 2025 [Data set]. Honolulu Open Data. https://data.honolulu.gov/d/4vab-c87q
Dauth, W., Mense, A., & Wrede, M. (2024). Affordable housing and individual labor market outcomes (IZA Discussion Paper No. 17359). Institute of Labor Economics.
D’Amico, L., Soltas, E., & Wang, A. (2026, September). Where is housing slow to build, and is it getting slower? [Working paper]. University of Chicago Booth School of Business and Princeton University.
Hawai‘i Department of Business, Economic Development and Tourism. (n.d.). Construction Cost Index. State of Hawai‘i.
Hawai‘i Department of Labor and Industrial Relations, Wage Standards Division. (2025). Wage rate schedule (Bulletin No. 509). https://labor.hawaii.gov/wsd/files/2025/09/WRS509.pdf
Hsieh, C.-T., & Moretti, E. (2019). Housing constraints and spatial misallocation. American Economic Journal: Macroeconomics, 11(2), 1–39.
Lynch, E. (2024, May 10). High interest rates, construction costs are serious impediments for new multifamily development. Eye On Housing, National Association of Home Builders.
National Multifamily Housing Council. (2024, March 26). Quarterly survey of apartment construction & development activity (March 2024).
Takeuchi Apuna, D. (2026, July 22). Column: Consider all aspects of permitting woes. Honolulu Star-Advertiser. https://www.staradvertiser.com/2026/07/22/editorial/island-voices/column-consider-all-aspects-of-permitting-woes/
Title Guaranty. (2020–2026). Closed real estate sales records for selected parcels in Hawai‘i [Unpublished proprietary dataset].
U.S. Census Bureau. (2024a). Means of transportation to work by workers’ earnings in the past 12 months (in 2024 inflation-adjusted dollars) [Table B08119, American Community Survey 5-year estimates detailed tables].
U.S. Census Bureau. (2024b). Travel time to work [Table B08303, American Community Survey 5-year estimates detailed tables].
U.S. Census Bureau. (2024c). Household size by vehicles available [Table B08201, American Community Survey 5-year estimates detailed tables].
U.S. Census Bureau. (2024d). Sex of workers by means of transportation to work [Table B08006, American Community Survey 5-year estimates detailed tables].
U.S. Census Bureau. (2024e). American Community Survey 5-year estimates detailed tables [Table B08135].
U.S. Census Bureau. (2024f). American Community Survey 5-year estimates detailed tables [Table B08136].
Appendix Table 1: Simulation Parameters for Bill 7 vs. Standard Comparison in an A-2 District
| Parameter | Value |
| Lot Size | 10,000 sq ft |
| Height | 40 ft |
| Setbacks | 10 ft |
| Unit Mix | 50% studio (300 sq ft), 50% 1BR (500 sq ft) |
| Ground Floor Retail | No |
| Grant Type (Bill 7 Only) | Post-construction ($12,000 per unit, all 49 units income-restricted) |
| Park Dedication | Waived for Bill 7 projects per ROH §22-7.3(j). Standard is modeled with in-lieu fees. |
| Rent (as % AMI)[17] | 100% of units at 80% AMI |
| Base Hard Cost[18] | $450/sq ft |
| Prevailing Wage Premium (pre-construction grant only) | 45% of on-site labor (and on-site labor is 25% of hard cost) |
| Land Acquisition Cost | $200/sq ft[19] |
| Operating Expense Ratio | 19% of EGI |
| Permitting | 18 months |
| Construction | 12 months |
| Lease-up | 6 months |
| Hold Period | 10 years |
| Market Cap Rate | 5.10% |
| Equity Share | 30% |
| Permanent Loan Rate | 7.00% |
| Target Return[20] | 11.5% |
| Amortization | 25 years |
| Minimum DSCR | 1.20 |
| Floor Area Ratio (FAR) | 4.0 for Bill 7, 1.3 for pre-Ord. 26-7, 3.0 for post-Ord. 26-7 (see §21-3.3 (2025)) |
Appendix Table 2: Comparison of City-wide Capacity and Feasibility, Bill 7 vs. Standard Zoning (90% AMI)[21]
| Metric | Bill 7[22] | Standard (2026) | Standard (2019-25) | |
| Median project size (units) | 24 | 25 | 8 | |
| Max. legal units | Income- restricted | 211,813 | 0 | 0 |
| Market-rate | 0 | 239,250 | 117,595 | |
| Parcels with ROC ≥ 5.6% and positive RLV | 7,302 (93.0%) | 6,135 (78.1%) | 1,670 (21.3%) | |
| Units with ROC ≥ 5.6% and positive RLV | 209,629 (99.0%) | 223,008 (93.2%) | 67,654 (57.5%) | |
| Near-feasible parcels[23] | 5,171 (65.8%) | 2,574 (32.8%) | 148 (1.9%) | |
| Near-feasible units | 180,468 (85.2%) | 121,375 (50.7%) | 9,288 (7.9%) | |
Appendix Table 3: Comparison of City-wide Capacity and Feasibility, Bill 7 vs. Standard Zoning (100% AMI)
| Metric | Bill 7 | Standard (2026) | Standard (2019-25) | |
| Median project size (units) | 24 | 25 | 8 | |
| Max. legal units | Income- restricted | 211,813 | 0 | 0 |
| Market-rate | 0 | 239,250 | 117,595 | |
| Parcels with ROC ≥ 5.6% and positive RLV | 7,565 (96.3%) | 7,420 (94.5%) | 3,267 (41.6%) | |
| Units with ROC ≥ 5.6% and positive RLV | 211,248 (99.7%) | 237,934 (99.4%) | 92,441 (78.6%) | |
| Near-feasible parcels | 7,086 (90.2%) | 5,910 (75.2%) | 1,489 (19.0%) | |
| Near-feasible units | 207,927 (98.2%) | 219,780 (91.9%) | 62,220 (52.9%) | |
[1] Rents cited throughout this report reflect this maximum rent permitted under the program rather than actual rents, unless otherwise specified. An internal review of rental listings through Jan. 2026 indicated that units in Bill 7 projects have typically rented for 68–72% AMI, well below the statutory ceiling.
[2] Return on cost is the ratio of how much income a project will generate each year relative to the total cost of development. Residual land value is the most that a developer could pay for land after covering all other expenses.
[3] The model currently represents parking as a financial cost but not a spatial constraint. Any understatement this produces in the effects or challenges of constructing parking will be consistent across all pathways in proportion to the buildable square footage.
[4] Bill 7 projects are not exempt from environmental review ($1,800), administrative temporary occupancy ($200), erosion and sediment control ($250), stockpiling ($85), and grading ($1,055) permit fees. Because these fees scale with lot size and excavation volume, rather than with unit count or affordability, projects pay the same amount under both pathways.
[5] We use a ROC of 6.1% and a RLV of $200/sqft as a near-feasibility screen for policy use. The first is 50 basis points below the industry threshold of 6.6%, and the second equals the land acquisition cost assumed for the baseline project and is close to the median recorded sale price of Bill 7 project sites ($212/sqft). A project at these levels could pencil under slightly more favorable circumstances, such as a decline in interest rates, a below-market land deal, a creative capital stack, and/or an innovative cost-saving design.
[6] Rents are set equal across pathways to fairly compare their effects on feasibility, and because in practice developers building in the same areas must set their rents in relation to actual rents in those areas. Appendix Tables 2 and 3 present complete alternative scenarios with rents at 90% and 100% AMI. In those results, return on cost for Bill 7 rose to 6.7% and 7.4% (Table 4), and for Standard (2026) to 6.2% and 6.8%, respectively.
[7] Baseline is modeled with all units income-restricted to the same AMI, consistent with actual practice based on program data and developer interviews. As every unit is income-restricted, they all receive fee waivers, property tax exemptions, and post-construction grants.
[8] This line represents a hypothetical alternate grant program where the grant is paid up-front, unconditionally, for each income-restricted unit, to better illustrate the effects of the current design of the pre-construction grant, described in text below. It is an illustration, not a policy recommendation.
[9] Unit factor is a divisor that imposes a cap on the number of units in a Bill 7 project. Currently, ROH §32-2.8 calculates this as FAR * lot area ÷ 800, rounded down. Because FAR is currently 4.0, we simplify: 800 ÷ 4 = 200 above. A unit factor of 130 represents the revision of ROH §32-2.8 under Bill 18 (City and County of Honolulu, 2026a), which would allow one unit per 130 sf of lot area (no FAR).
[10] Through ROH Chapter 32, pre- and post-construction grants differ in coverage, timing, and additional costs. Under §32-4.2(c), the post-construction grant is paid per affordable unit and after construction. Whereas the “pre-construction” grant (more accurately, during-construction) applies for all units and is disbursed throughout the construction period as developers submit certified payrolls at prevailing wages for construction labor.
[11] Source: City and County of Honolulu, Department of Budget and Fiscal Services, 2025. Median assessed values calculated by the authors from parcel-level real property assessment records.
[12] Source: Title Guaranty (2020–2026). Median land values calculated by the authors using closed-sale transaction records for selected parcels.
[13] Currently there are 7,855 parcels eligible for Bill 7 development. UHERO calculates that increasing qualifying lot sizes to 40,000 sf could add up to 689 parcels: 433 parcels in the A and AMX districts, 42 parcels in the Waikiki special district, and (if separately approved) 214 parcels in the B and BMX districts.
[14] We compared the prevailing wage for 11 construction trades in the state’s wage rate schedule (Hawaii Department of Labor and Industrial Relations, 2025) with their respective median wages. The median premium across trades was 45%, which adds about 11% to hard costs when applied to on site labor.
[15] Of the 49 Bill 7 applications filed from 2019 to 2024, 21 had seen no review activity for at least 120 days when the legacy system was retired. Developer interviews confirmed this was a fair heuristic for a project that has been discontinued but not yet withdrawn.
[16] Treating all reviews that begin within 14 days of one another as a single cycle yields an average of 7.3 cycles, similar to what DPP reports. Treating reviews within 7 days as one cycle yields 10 cycles, and counting each distinct review period separately yields about 20.
[17] Though the law allows Bill 7 to dedicate just 80% of units at 100% AMI, developers in practice usually dedicate 100% of units to 80% AMI, which qualifies the entire project for fee waivers and tax exemptions.
[18] Hard costs are escalated at 5.6% per year to the midpoint of the construction draw, thus longer project timelines can increase the base hard cost per sf.
[19] Land acquisition costs are modeled at $200/sqft to reflect market land prices for approved Bill 7 projects.
[20] Target return is the annual cost of capital on the land, used to discount residual land value back to the purchase date. It differs from return-on-cost, which is stabilized NOI divided by total development cost.
[21] The primary purpose of this study was to evaluate how Bill 7 affects development feasibility for comparable units. To do this fairly required holding rents constant, even though units built under the standard pathway would be market-rate, not income-restricted. This table and the following illustrate how development feasibility for all pathways improves when modeled with higher rents.
[22] Calculations for the Bill 7 pathway in this table and the following one account for the loss of the property tax exemption, which is only available to projects restricted to 80% AMI or below. Fee waivers still apply, since every unit remains income restricted.
[23] See footnote 5.
Gordner, T., Takahashi, S., Prager, E., & Munoz, R. C. (2026). Assessing Honolulu’s “Bill 7” Housing Program. UHERO. https://uhero.hawaii.edu/assessing-honolulus-bill-7-housing-program/
Gordner, Trey, et al. "Assessing Honolulu’s “Bill 7” Housing Program." UHERO, 9 November 2026, https://uhero.hawaii.edu/assessing-honolulus-bill-7-housing-program/.
Trey Gordner, Sakura Takahashi, Edith Prager, and Rafael Cecilio Munoz. "Assessing Honolulu’s “Bill 7” Housing Program." UHERO, November 9, 2026. https://uhero.hawaii.edu/assessing-honolulus-bill-7-housing-program/.
@techreport{gordner2026,
  author  = {Trey Gordner, Sakura Takahashi, Edith Prager, Rafael Cecilio Munoz},
  title   = {Assessing Honolulu’s “Bill 7” Housing Program},
  year    = {2026},
  month   = {November},
  institution = {University of Hawaiʻi Economic Research Organization},
  type        = {UHERO Research},
  url     = {https://uhero.hawaii.edu/assessing-honolulus-bill-7-housing-program/}
}UHERO gratefully acknowledges the supporters whose contributions make this work possible.