
UHERO Insights
Introducing the Housing Policy Simulator

INSIGHTS ARE PRELIMINARY MATERIALS CIRCULATED TO STIMULATE DISCUSSION AND CRITICAL COMMENT.
The findings and recommendations are those of the author(s) and do not reflect the views or official positions of UHERO, the University of Hawai’i, or any funding or supporting organization.
Gordner, T., Takahashi, S., & Prager, E. (2026). Introducing the Housing Policy Simulator. UHERO. https://uhero.hawaii.edu/introducing-the-housing-policy-simulator/
Gordner, Trey, et al. "Introducing the Housing Policy Simulator." UHERO, 9 November 2026, https://uhero.hawaii.edu/introducing-the-housing-policy-simulator/.
Trey Gordner, Sakura Takahashi, and Edith Prager. "Introducing the Housing Policy Simulator." UHERO, November 9, 2026. https://uhero.hawaii.edu/introducing-the-housing-policy-simulator/.
@misc{gordner2026,
  author  = {Trey Gordner, Sakura Takahashi, Edith Prager},
  title   = {Introducing the Housing Policy Simulator},
  year    = {2026},
  month   = {November},
  howpublished = {\url{https://uhero.hawaii.edu/introducing-the-housing-policy-simulator/}},
  note        = {UHERO},
  url     = {https://uhero.hawaii.edu/introducing-the-housing-policy-simulator/}
}Introduction
High housing costs place a substantial burden on Hawaiʻi residents and contribute to broader economic challenges, including outmigration and difficulties attracting and retaining workers. Increasing the supply of housing is an important part of addressing these challenges, but residential construction has remained low relative to historical levels, even while home prices have risen[1]. High land and construction costs, interest rates, and regulatory requirements each play a role in lowering production by reducing the financial feasibility of new development. Conversely, State and local government programs intended to spur housing production succeed only if the projects they enable will earn more than they cost to build.
Estimating the impact of housing policy on development feasibility has historically been difficult. But today, UHERO is releasing a tool to make it easy for policymakers and the public to understand the math behind housing development and explore why some policies make housing feasible and others may have little effect. The Housing Policy Simulator shows how regulations, project characteristics, and market conditions affect development feasibility–both on individual properties and islandwide. The simulator was made possible by financial support from the Department of Housing and Land Management of the City and County of Honolulu, and by feedback from local experts in real estate development, permitting, and commercial lending.
How Development Feasibility is Determined
Before permitting or construction, a developer has to determine if a project “pencils,” i.e., whether the project will earn enough to justify building it. The process starts with building a pro forma, a financial model that projects and evaluates costs and revenues. Table 1 provides a simplified example.
Table 1. Example Pro Forma of a Multifamily Rental Project Under Standard Zoning
| Year 1 | Year 2 | Year 3 | |
|---|---|---|---|
| Gross Potential Income | $1,042,000 | $1,084,000 | $1,127,000 |
| Vacancy & Credit Loss | ($77,000) | ($80,000) | ($83,000) |
| Effective Gross Income | $965,000 | $1,004,000 | $1,044,000 |
| Operating Expenses | ($290,000) | ($300,000) | ($310,000) |
| Property Tax | ($32,000) | ($33,000) | ($33,000) |
| Net Operating Income | $643,000 | $671,000 | $701,000 |
| Debt Service | ($536,000) | ($536,000) | ($536,000) |
| Cash Flow | $107,000 | $135,000 | $165,000 |
The first three years of operation for a 22-unit project under standard zoning, using the Housing Policy Simulator’s default assumptions, with all units rented at 120% of area median income (AMI).
On the cost side are hard costs (construction itself), soft costs (design fees and other professional services), pre-development costs, and financing. On the revenue side, the model starts with the rent the building is able to collect, minus vacancy, operating expenses, and property taxes, to arrive at net operating income (NOI). That income stream determines what the finished building is worth, also known as its gross development value.
To judge feasibility, developers work backward from that value. They subtract every cost except land, including their target profit margin and how much they must pay back to lenders, to find the residual land value: the most that they could pay for the site and still make the project financially feasible. If the residual land value is higher than what the land actually costs, the project pencils. Many of these inputs depend on market conditions, but some, such as fees, permitting, and property tax, are set by policies. As a result, public policy is one of several factors that determines whether a project pencils.
How Public Policy Affects Development Feasibility
Housing affordability and availability are perennial policy issues in Hawaiʻi. Often, the policies proposed to address these issues affect development feasibility in some way. Inclusionary zoning, for example, is a policy that requires developers to include a certain share of income-restricted housing in new projects. The Hawaiʻi Community Development Authority’s reserved housing program and the City and County of Honolulu’s affordable housing requirement are both examples of inclusionary zoning. If the developer cannot “cross-subsidize” the income-restricted units by raising the price on unrestricted units, then the overall amount of revenue they can earn from the project will fall–and with it, the amount that they can pay for land. The magnitude of the effect varies with the required share, term length, and income level. Policymakers must be careful with the design of these requirements, since if they are set beyond what is feasible, then no housing projects subject to them will be built–a counterproductive policy outcome that would reduce the availability and affordability of both market-rate and affordable units.
Recognizing this, other affordable housing programs seek to balance any revenue-reducing effects with reductions in costs. The Hawaiʻi Housing Finance and Development Corporation’s 201H-38 program, for example, requires that the majority of housing units be sold at no more than 140% AMI, but allows developers to request waivers from regulations that limit the size of the projects they can build, along with fees charged by government agencies to process permits or connect utilities. Honolulu’s “Bill 7” program similarly waives certain fees and regulations for rental housing affordable to 100% AMI, and goes even further by offering grants to developers based on the number of units in the project[2]. Other city and State programs help affordable projects pencil by providing land or loans at below-market prices.
Each of these policies affect different lines in the pro forma to different extents at different periods in the development process. It can be difficult for policymakers and the public to understand how much regulations cost, how much incentives are worth, and whether together they equate to a windfall or a wipeout for developers. This is particularly true because the costs and benefits of these programs can vary with market and site conditions. A program that works well when interest rates are at 5% may stop working at 6.5%. A program that works well on larger lots may not work well on smaller ones. An effective housing program must be calibrated carefully–and recalibrated often–to ensure it meets its policy objectives. Yet this analysis is rarely done, because of the time, expense, and complexity involved.
Introducing the Housing Policy Simulator
Today, UHERO is releasing a new tool that produces realistic development feasibility analysis in the City and County of Honolulu. The Housing Policy Simulator is organized into different development pathways, the set of rules under which a project can be built. Users can choose standard zoning or programs that trade incentives for affordability, such as Bill 7 housing, transit oriented development (TOD), and 201-H. Each pathway can be explored in two ways.
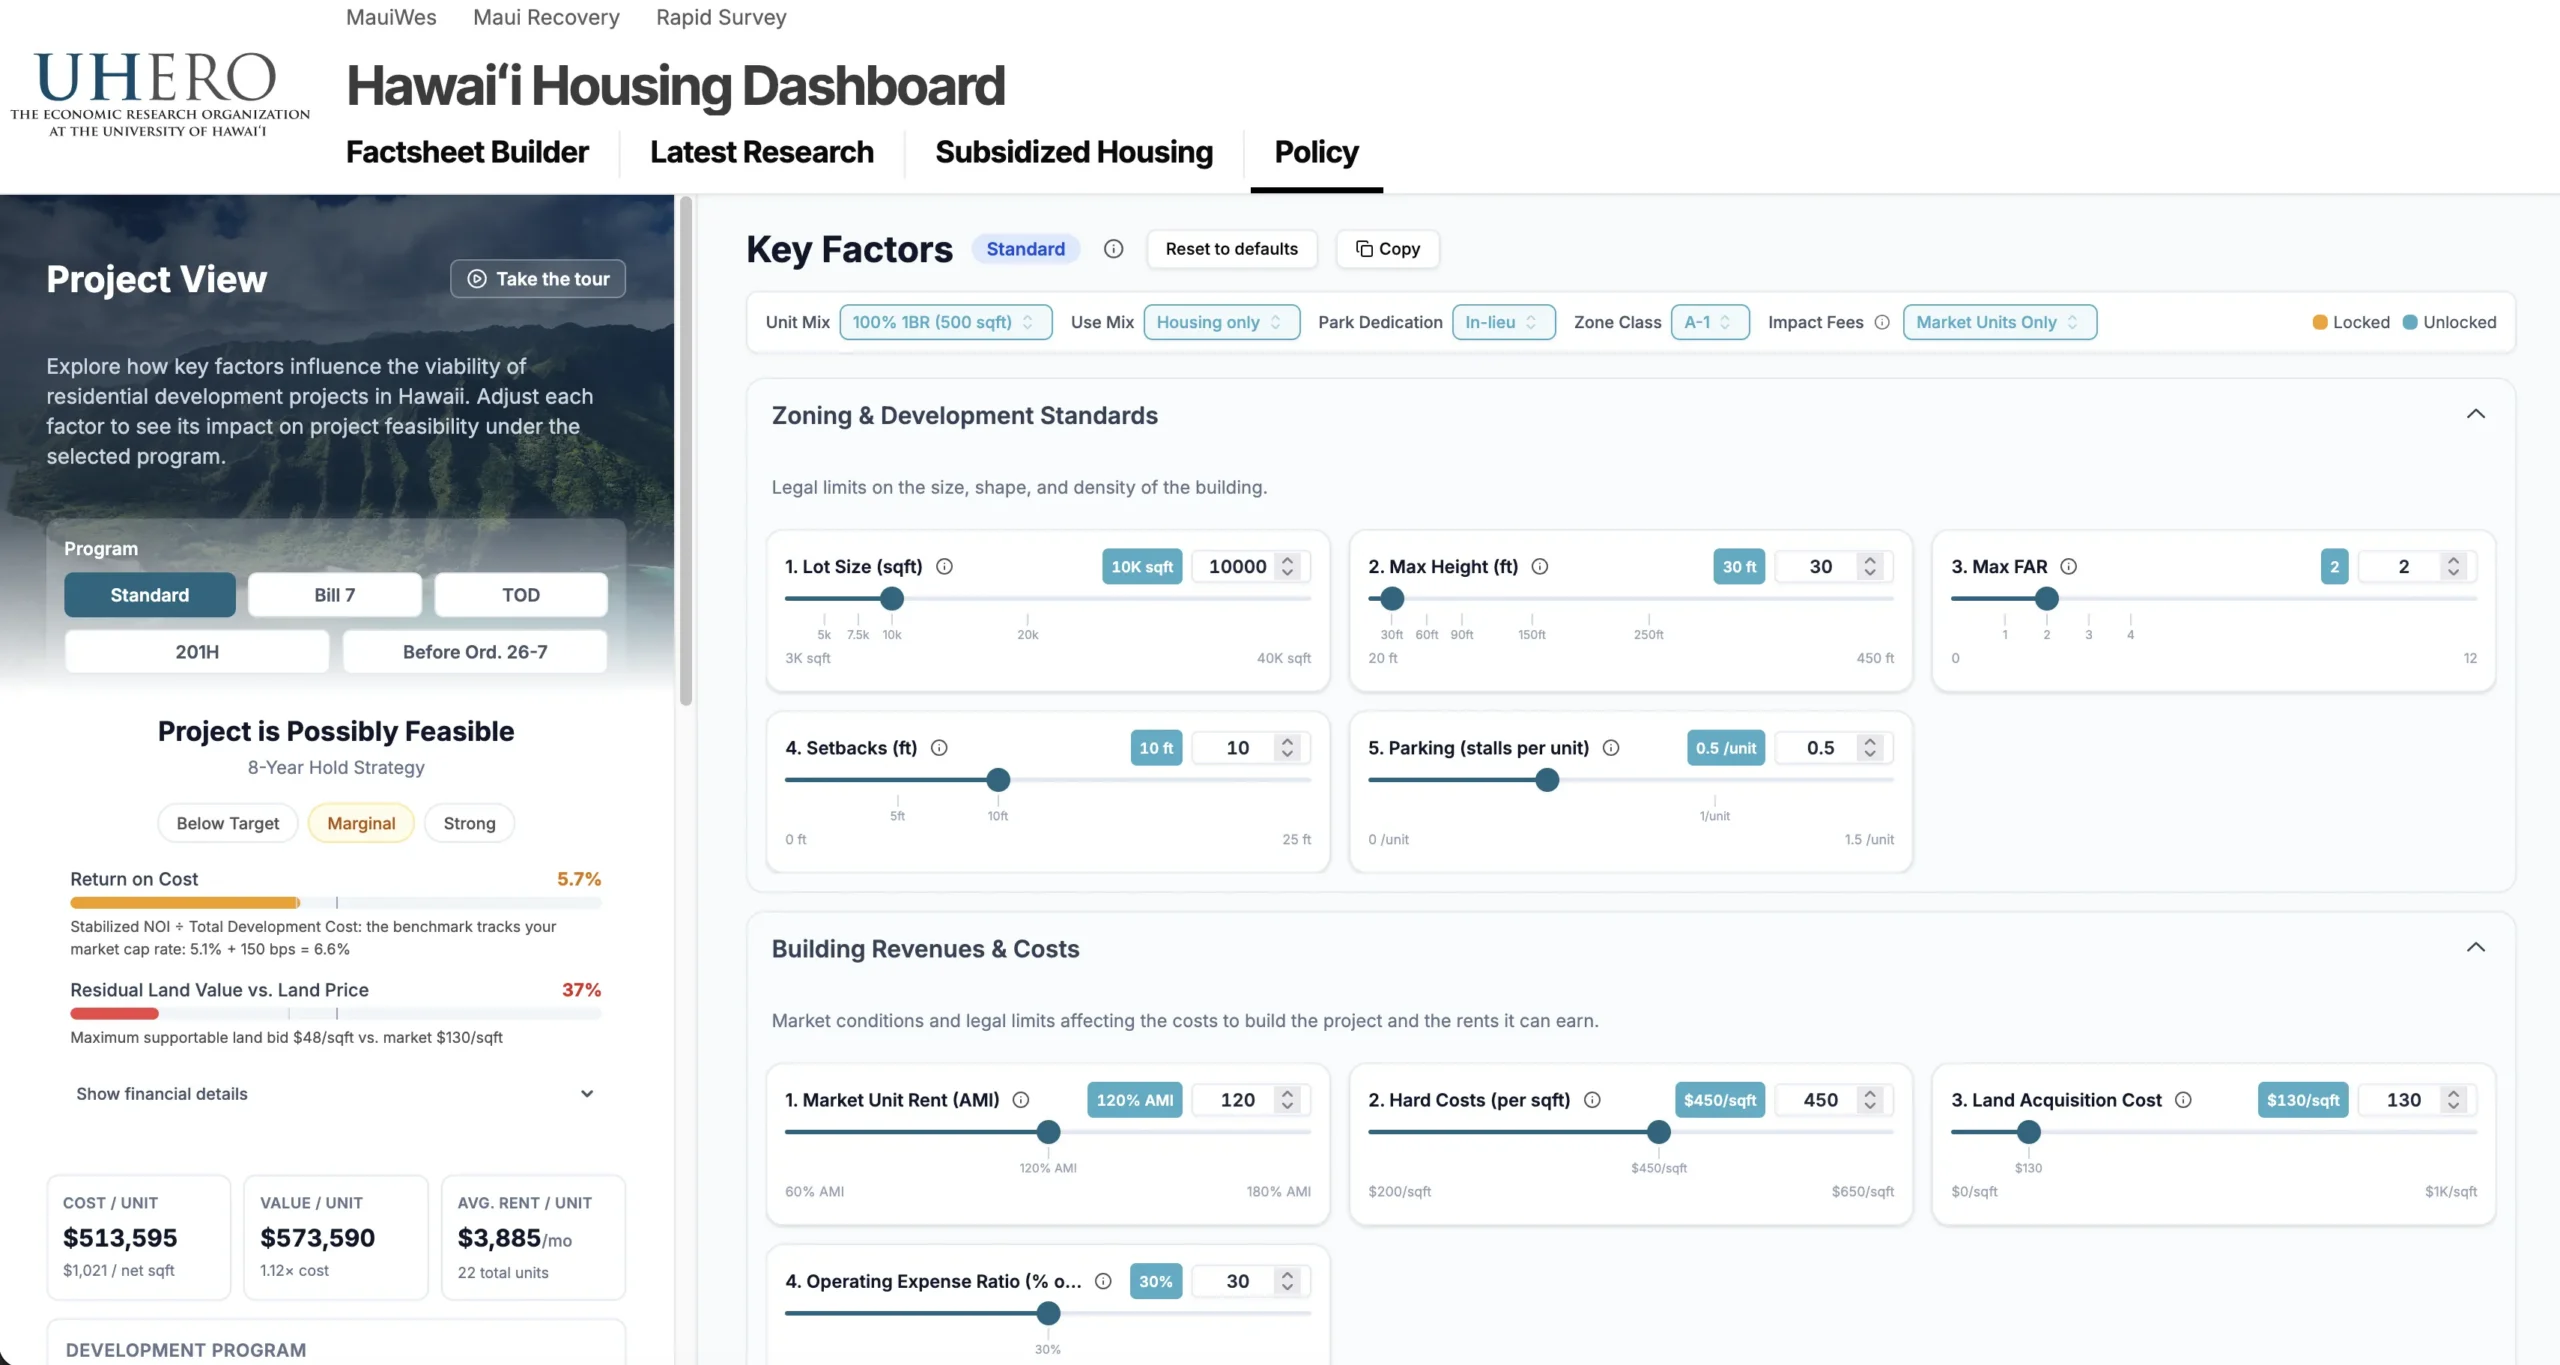
The Project View models a single hypothetical building. Users pick a pathway and adjust the assumptions that shape the project, from lot size and height limits, to unit sizes and rents, to construction costs, timing, and loan terms. As each one changes, the simulator recalculates the pro forma and updates its verdict on feasibility.
Figure 1. Housing Policy Simulator, Project View
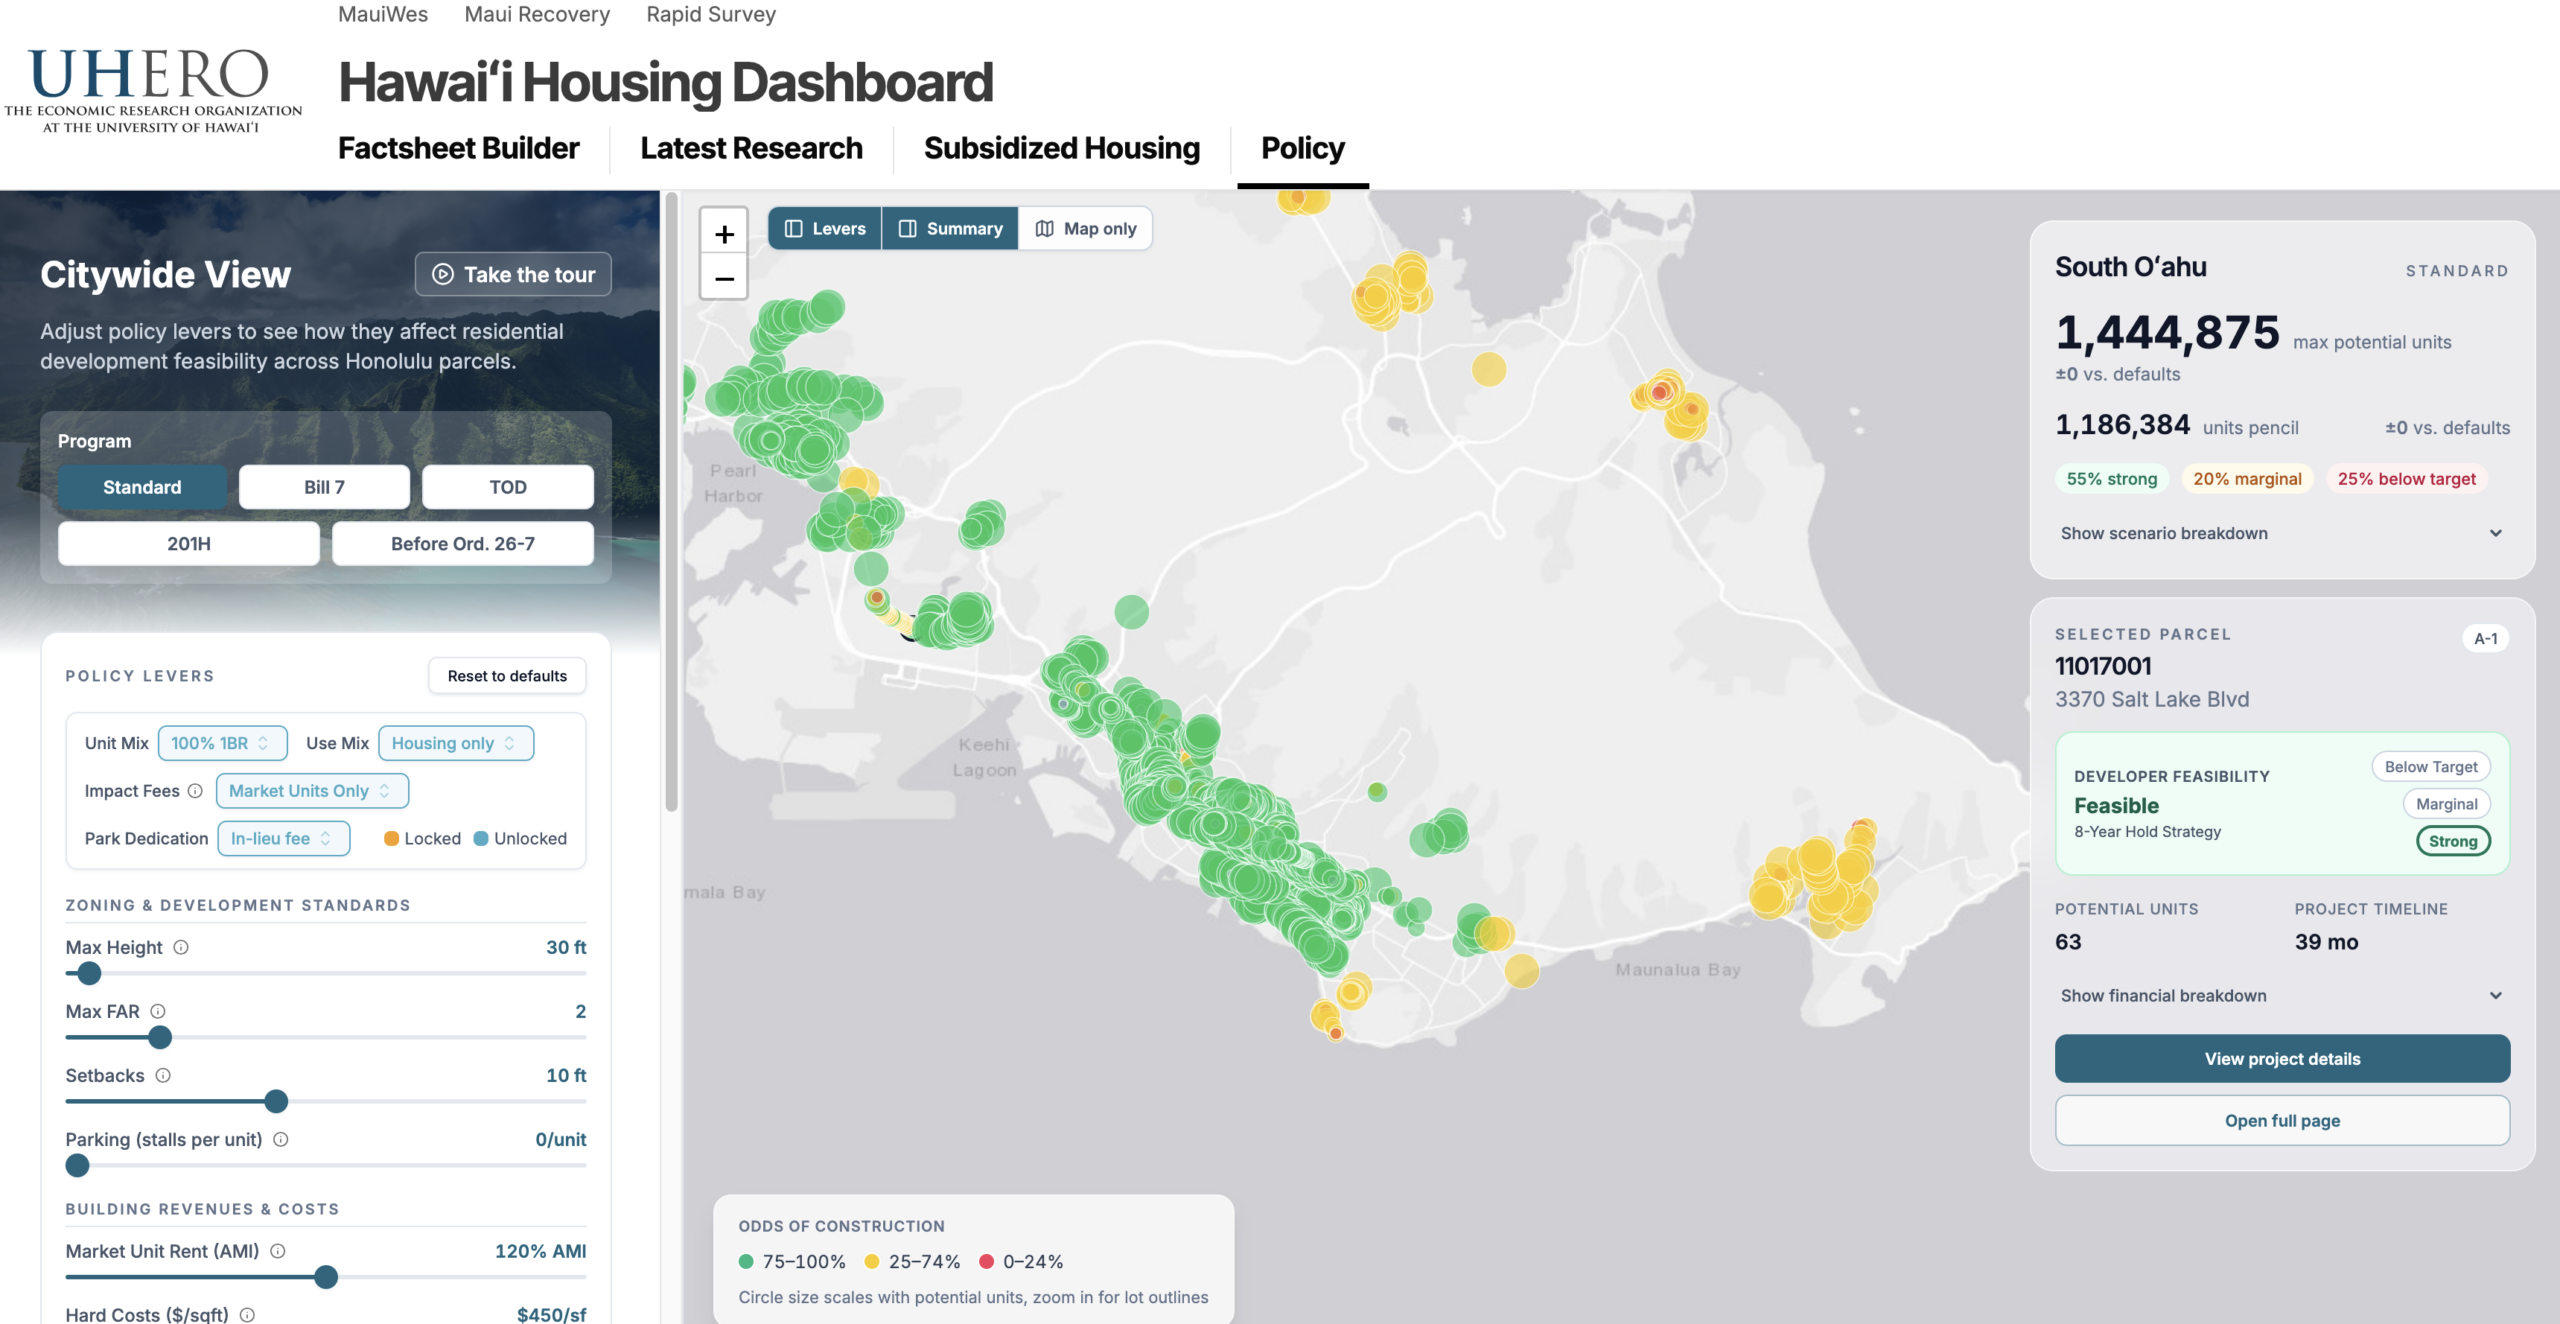
The Citywide View applies the same calculation to every eligible parcel on O‘ahu. Instead of asking whether one project works, it answers how many projects would work under a given set of rules, where those projects would be located, and how many units they could produce in all. Moving any assumption updates the map and calculations. Clicking a parcel opens its own pro forma.
Figure 2. Housing Policy Simulator, Citywide View
Both views include a short guided tour, and every assumption has an informational tooltip explaining what it means and its sources, so no background knowledge in real estate, finance, or housing development is needed to start testing. Users can imagine themselves as developers trying to design a project that pencils, or as policymakers redesigning housing programs. In both cases, the Housing Policy Simulator provides live feedback on how their choices make housing projects more or less feasible.
What the Tool Can and Can’t Say
The Housing Policy Simulator is a financial model, not a prediction model. A green parcel indicates that a project would work financially given the user’s input values, not that it will be built. Whether a project moves forward can depend on circumstances the model does not capture, such as landowner interest, infrastructure capacity, environmental constraints, and community approval. The simulator is intended to facilitate comparisons between different housing programs, rules, or market conditions–not to estimate production. It is also not a source of investment or legal advice.
And, like any model, the Housing Policy Simulator depends on its assumptions. The default inputs for construction costs, rents, land prices, and financing terms are based on research gathered by the UHERO team, including interviews with local developers and lenders. While UHERO will continue to update these values over time, they should not be seen as accurate, real-time reflections of market conditions. Users also have the ability to adjust many of these assumptions to fit their own estimates or hypotheticals.
Final Remarks
Housing policy involves many tradeoffs, including depth of affordability, breadth of program scope, and project size and scale. These tradeoffs are easier to discuss when everyone can see the math behind each choice. Our goal with the Housing Policy Simulator is to make the financial side of those debates transparent, so that council members, policymakers, developers, advocates, and residents can test current and proposed rules and see what they are likely to produce. In Assessing Honolulu’s “Bill 7” Housing Program, we demonstrate the full potential of the tool for policy analysis and evaluation. The Housing Policy Simulator is available at https://analytics.uhero.hawaii.edu/housing/policy. Readers interested in the details can find the full documentation in the Housing Policy Simulator Repository. If an assumption does not match your experience, or if you have feedback, please reach out at uheroweb@hawaii.edu.
[1] Private Residential Units Authorized, Annual, State of Hawaii, 1982-2025. UHERO Data Portal. https://data.uhero.hawaii.edu/#/series?id=150869&sa=false&geo=HI&freq=A&start=1982-01-01
[2] City and County of Honolulu. (2019). Ordinance 19-8: An ordinance relating to affordable rental housing (Bill 7). Honolulu City Council.