BLOG POSTS ARE PRELIMINARY MATERIALS CIRCULATED TO STIMULATE DISCUSSION AND CRITICAL COMMENT. THE VIEWS EXPRESSED ARE THOSE OF THE INDIVIDUAL AUTHORS. WHILE BLOG POSTS BENEFIT FROM ACTIVE UHERO DISCUSSION, THEY HAVE NOT UNDERGONE FORMAL ACADEMIC PEER REVIEW.
By Rachel Inafuku. Joint research with Tim Halliday, Lester Lusher and Aureo de Paula.
Introduction
While an extensive number of studies have shown that pollution is detrimental to human health, a smaller, growing body of literature has found that pollution also negatively impacts cognitive performance. Research has shown that increases in pollutants lead to decreased labor productivity amongst both mentally and physically demanding careers. While the cognitive performance literature is already sparse, even less is known about the effects of pollution on student test scores. Test scores not only give insight into cognitive performance, but also often influence future labor market outcomes (Ebenstein et al., 2016).
So far, there have been a few studies that evaluated pollution effects on test scores. Work from Ebenstein et al. (2016) observed high school exit exam scores amongst Israeli students from 2000 to 2002 and found increased pollution led to decreases in test scores and worsened long run outcomes. Several studies in the US also identified poorer test scores in response to worsening air quality. Marcotte (2017) found decreased exam performance amongst kindergarteners during exam days with high levels of pollen and fine airborne particulate matter. Using air traffic pollution, Heissel et al. (2020) observed decreased student performance in response to higher levels of pollution.
In this study, we assess the impacts of pollution on standardized test scores amongst public school students within the state of Hawaii. The Hawaiian islands are particularly advantageous for studying the effects of pollution for several reasons. First, Hawaii is home to pristine baseline levels of air quality with average pollutant levels well below EPA ambient air quality standards. Most studies have focused on areas with extremely high average pollution levels and are much less comparable to most areas within the US. Furthermore, the level of pollutants throughout Hawaii is truly unpredictable and random. Because the bulk of pollution throughout the state is dependent on emissions from Kilauea volcano and wind direction, air pollution is based largely on the forces of nature and not man made sources (e.g., traffic, industrial facilities, etc).
Data
Data on the students in our sample comes from the Hawaii P-20 Partnerships for Education (Hawaii P-20) which manages student level data collected through the Data eXchange Partnership (DXP), a collaboration between five state agencies (Department of Health, Department of Labor and Industrial Relations, Department of Education, Department of Human Services, and University of Hawaii). The student level data in this study consists of all public school students in the state of Hawaii for the years 2015 through 2018. Within our sample, about half of the students are considered economically disadvantaged and roughly 6% received English language services. Our sample of students also represent Hawaii’s rich ethnic diversity with 24% of students identifying as Native Hawaiian, 24% Filipino, 18% White, 16% Asian (non-Filipino), 9% Pacific Islander, and 8% another ethnicity. In total, the sample consists of over 150,000 unique individuals across 260 schools.
We observe exam scores for the Smarter Balanced Assessment (SBA). Each year, all Department of Education (DOE) students in grades 3 through 8 and 11 are required to take the SBA, a two part annual assessment of math and English literacy skills created to measure college and career readiness. While the average student in our sample takes their exams towards the end of the school year, exam dates are unique to each student. The DOE gives all schools a one to three month testing window depending on the class scheduling structure within each school. Schools are then individually responsible to determine exam dates for their students. This is important since students within the same schools and more importantly classes may take the same exam on different days that may have more or less pollution, providing more variation for our study.
Our air quality data comes from the State of Hawaii Department of Health (DOH). We specifically look at the particulates PM2.5 and sulfur dioxide SO2 to measure pollution levels. The particulate, PM2.5, is measured in micrograms per cubic meter (μg/m3) and SO2 is measured in parts per billion (ppb). The DOH collects data on particulate levels through their pollution monitoring stations which span across 15 locations throughout the state (Figures 1 & 2). This study uses data from 12 of the monitoring stations located on Oahu, Maui, Kauai and Hawaii island.
Figures 1 & 2: Schools and Monitoring Stations
Figure 1: On Oahu
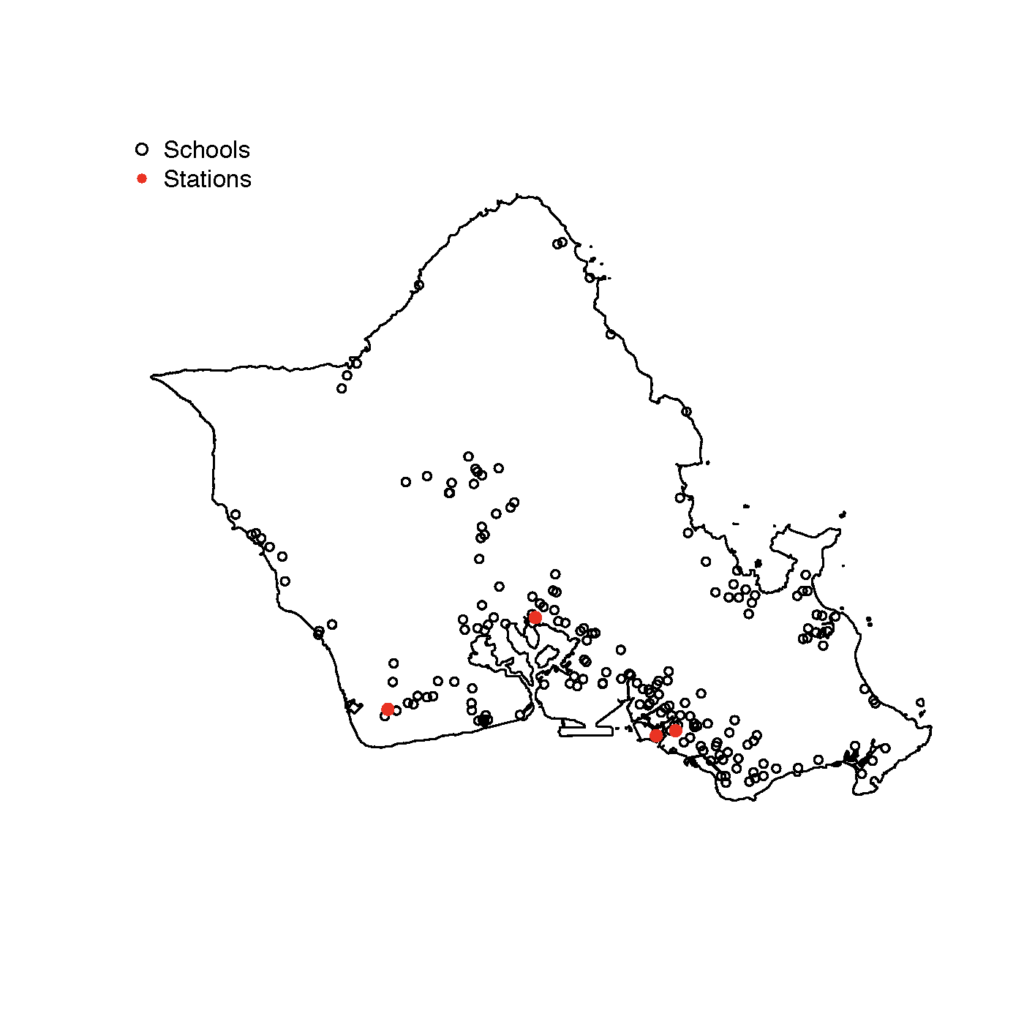
Figure 2: On Hawaii Island
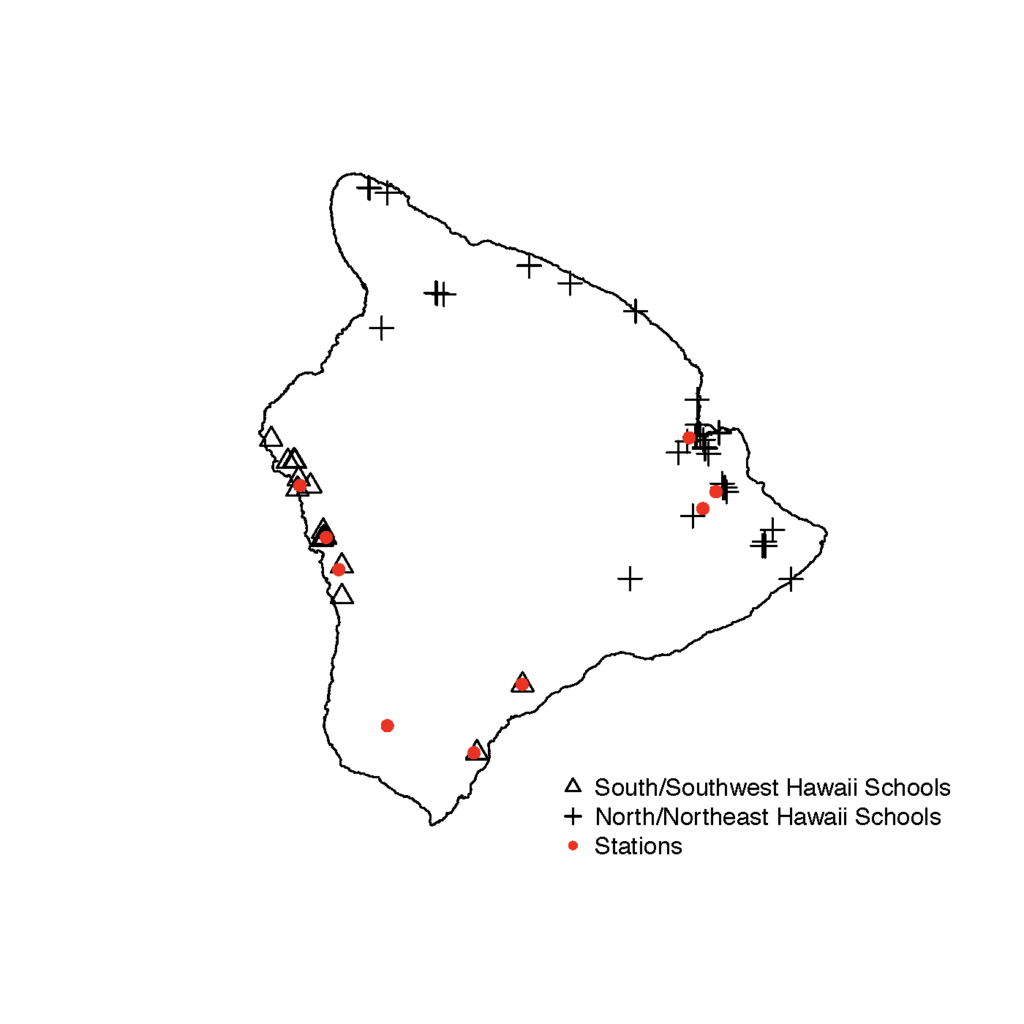
Notes: These figures display all pollutant monitoring stations and schools located on the island of Oahu and on the island of Hawaii.
We present summary statistics for our pollutant measurements in Table 1. Overall, levels of PM2.5 are similar across Oahu, Maui and Kauai ranging from 3 to 4 μg/m3 on average. Furthermore, SO2 is also similar across these islands with average levels well under 1 ppb. Stations on Hawaii island have higher average levels of both PM2.5 and SO2 due to their closer proximity to Kilauea volcano. The Ocean View and Pahala stations are located in South Hawaii closest to Kilauea volcano and thus have extremely high baseline levels of SO2.
Table 1 : Summary Statistics (Pollutant Measures)
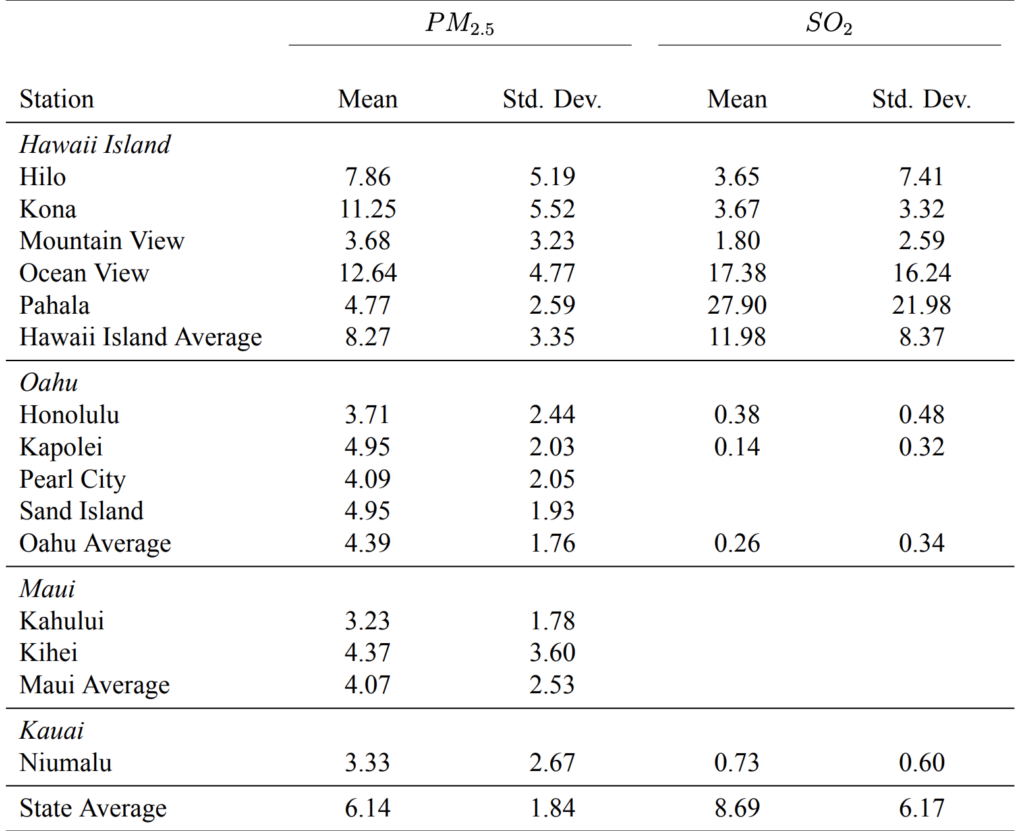
Notes: Data on pollutant measures come from the State of Hawaii Department of Health. Measures of PM2.5
and SO2 are reported for each pollutant monitoring station. The particulate PM2.5 is reported in μg/m3 and
SO2 is reported in ppb.
Results
Using wind variation and pollution measurements from the DOH monitoring stations, we predict levels of PM2.5 and SO2 within schools. We then use these predicted measures of air particulates to look at the impact of pollution on SBA scores. We first find that an increase in PM2.5 leads to a small decrease in student test scores. Specifically, a standard deviation (1.84 μg/m3) increase in PM2.5 leads to a 0.24% decrease in SBA scores on average.
We also find that pollution effects are substantially larger for students who attend schools with poorer average air quality. Specifically, declines in test scores for schools with an average of 9 μg/m3 of PM2.5 or higher experience roughly seven times the decline in test scores of those with less than 9 μg/m3. This nonlinear effect is also evident when focusing our analysis on the South region of Hawaii island which is home to Kilauea volcano and has much higher average levels of pollution compared to the rest of the state. In this area, the effect of increases in PM2.5 on student performance is roughly five times greater than estimates for the total sample.
It may also be the case that poorer air quality affects some students more than others within schools. We find that students who are economically disadvantaged perform worse on their SBA exams than students who are better off. Specifically, disadvantaged students face ten times the effect of PM2.5 on exam scores and six times the effect of SO2 (Figure 3). Interestingly, the pollution effects are not stronger for schools with a higher percentage of disadvantaged students. Instead, we find that as pollution increases, disadvantaged students perform worse on average regardless of their school’s location and resources. This follows previous studies which have found that poorer children are subject to worse health outcomes (Case et al., 2002) and may be more susceptible to environmental pollution.
Figure 3: Disproportionate Effects of Air Pollutants on Exam Scores by Economic Disadvantage Status
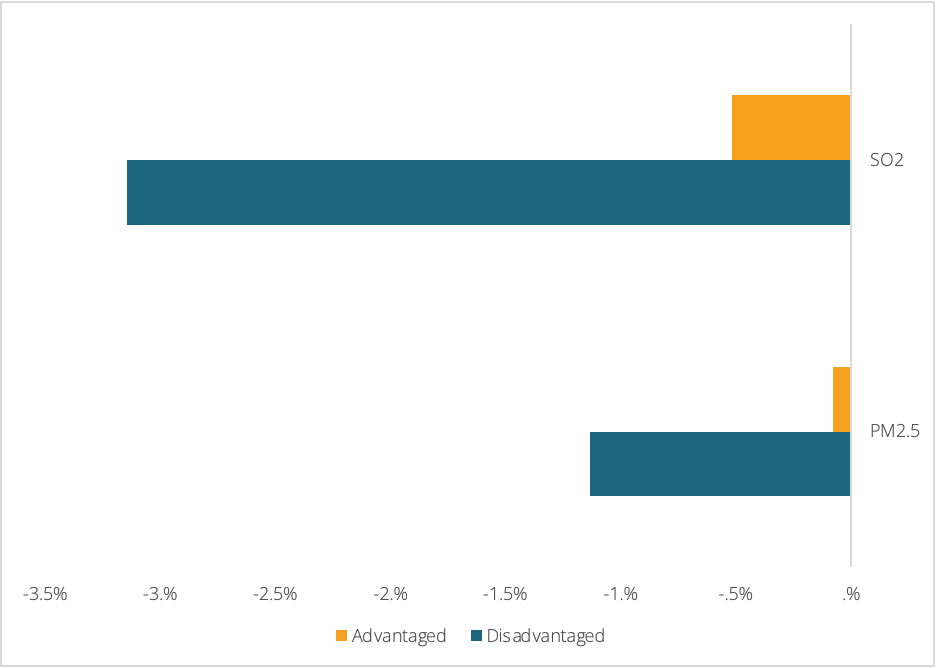
Notes: Effects are based on a standard deviation increase in PM2.5 (1.84 μg/m3) and SO2 (6.17 ppb)
Conclusion
Taken together, using test scores as a proxy for cognitive performance, we find that pollution negatively impacts students’ performance, but this effect is larger for some than others. As pollution increases, schools that are located in areas with higher pollution levels on average are subject to worse test score outcomes. This finding is potentially due to students experiencing more long-term exposure to particulates in these relatively high polluted areas. Moreover, increases in pollution affect students disproportionately within schools as poorer students face much larger decreases in their test scores compared to their advantaged peers. This finding has great implications for environmental justice. Students who are more financially stable face less obstacles in accumulating human capital when air quality is poor, suggesting that pollution contributes to the inequality gaps that we observe here in Hawaii and in the US.
References
Case, A., D. Lubotsky, and C. Paxson (2002): “Economic status and health in childhood: The origins of the gradient,” American Economic Review, 92, 1308–1334.
Ebenstein, A., V. Lavy, and S. Roth (2016): “The long-run economic consequences of high stakes examinations: Evidence from transitory variation in pollution,” American Economic Journal: Applied Economics, 8, 36–65.
Halliday, T., Lusher, L., Inafuku, R., & de Paula, A. (2022). VOG: Using Volcanic Eruptions to Estimate the Impact of Air Pollution on Student Learning Outcomes.
Heissel, J. A., C. Persico, and D. Simon (2020): “Does Pollution Drive Achievement? The Effect of Traffic Pollution on Academic Performance,” Journal of Human Resources, 1218–9903R2.
Marcotte, D. E. (2017): “Something in the air? Air quality and children’s educational outcomes,” Economics of Education Review, 56, 141–151.