Kauai Economic Dashboard
Kauai County Office of Economic Development


About the Kauai Dashboard
This dashboard provides Kauai economic data at a glance. The current version is a prototype. All features are subject to change without notice.
Feature Overview
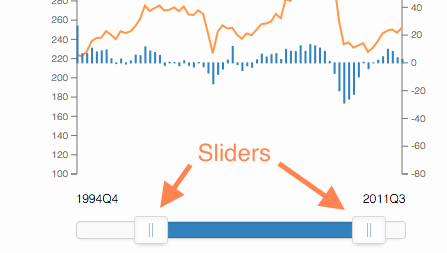
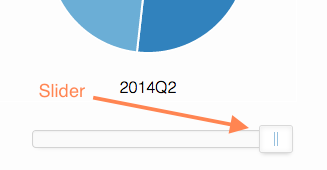
The date range for graphs is controlled by the sliders below each graph.
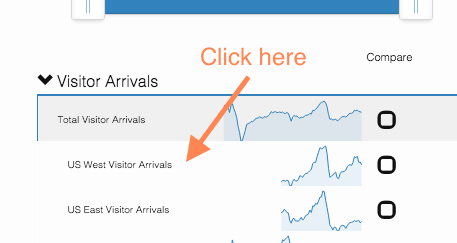
You can select a new series to graph by clicking on its row in the table.
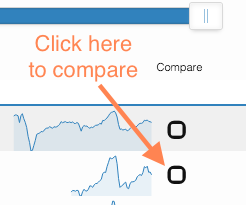
You can add a data series to compare to by clicking the compare box in the table.
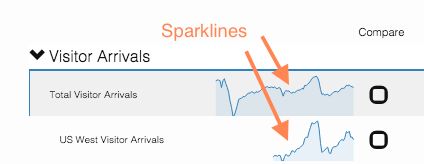
The table has little sparkline graphs that allow you to see thumbnail views of movements of each series over time.
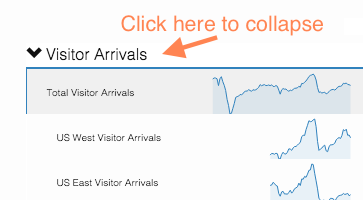
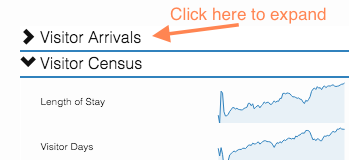
You can collapse and expand sections of the table as you like.
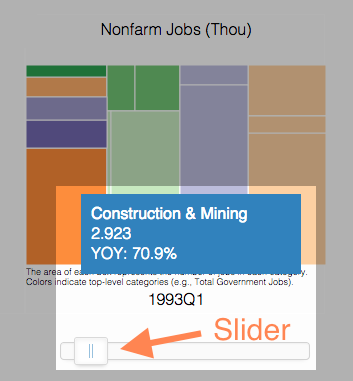
On the labor market page, we have implemented a treemap that shows the relative size of each industry in Kauai.
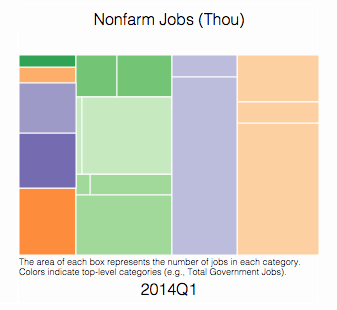
If you hover over a rectangle its shows you the number of jobs in the sector and its year-on-year growth rate for the selected period.
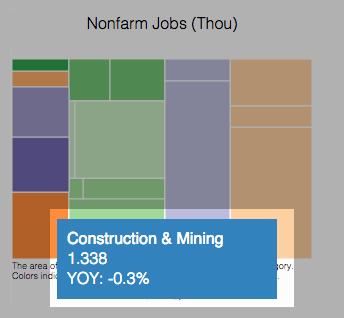
Move the slider and see how the relative importance of sectors ebbs and flows over time. (For example, see how big the construction industry was in early 1993!)
For more information, email us at uhero@hawaii.edu.