By Michael Roberts
How much will it cost to eliminate use of fossil fuels? There is reason for optimism. Technological progress has lowered the cost of wind and solar power to make them competitive with coal and natural gas on a levelized basis. Despite this progress, a recent study by Gowrisankaran, Reynolds and Samano, “Intermittency and the Value of Renewable Energy” (JPE, 2016) indicates that the variability of solar and wind power makes the system-wide costs grow considerably as their share of the power mix rises. While battery costs are falling too, they are still expensive, and cannot easily deal with seasonal or episodic variation in supply.
To economists, the obvious solution to intermittency is real-time retail pricing that reflects the incremental cost and marginal willingness to pay for electricity. Variable pricing would create powerful incentives to efficiently store energy on a distributed basis or otherwise shift consumption from times and places of relatively scarce renewable supply to times and places of plenty. Electricity consumers already have access to many low-cost appliances and devices that store energy in different forms. By carefully timing water heating, electric vehicle charging and water pumping, using ice storage for cooling systems, making micro-adjustments for some kinds of refrigeration, or other means, electricity use can be shifted from seconds to many hours at low cost. Such mechanisms would need to be automated by smart devices acting on customers’ behalf. These technologies can make electricity demand highly substitutable over time, at least over horizons up to a day or so. In addition to shifting the timing of electricity consumption within the day, customers facing dynamic prices can also adjust the total amount of power they consume each day, reducing total consumption during extended periods when power is scarce, or increasing it when power is abundant.
In a new study, Imelda, Matthias Fripp and Michael Roberts develop a novel model of power supply and demand to examine the extent to which variable pricing can make renewable energy more cost effective in the state of Hawai‘i. The model is novel in the way it simultaneously optimizes investment in generation capacity, storage capacity, and real-time operation of the system, including an account of reserves, a demand system with different interhour elasticities for different end uses, as well as substitution between electric power and other goods and services. Both supply and demand sides of the model can also provide reserves. The model is an extension of Switch, developed by Matthias Fripp in his PhD dissertation and applied to California. Earlier versions of the model (lacking reserves and demand-side integration) have also been implemented the western United States and other areas. The model is open source and fully adaptable to other settings, but requires a rather substantial amount of data.
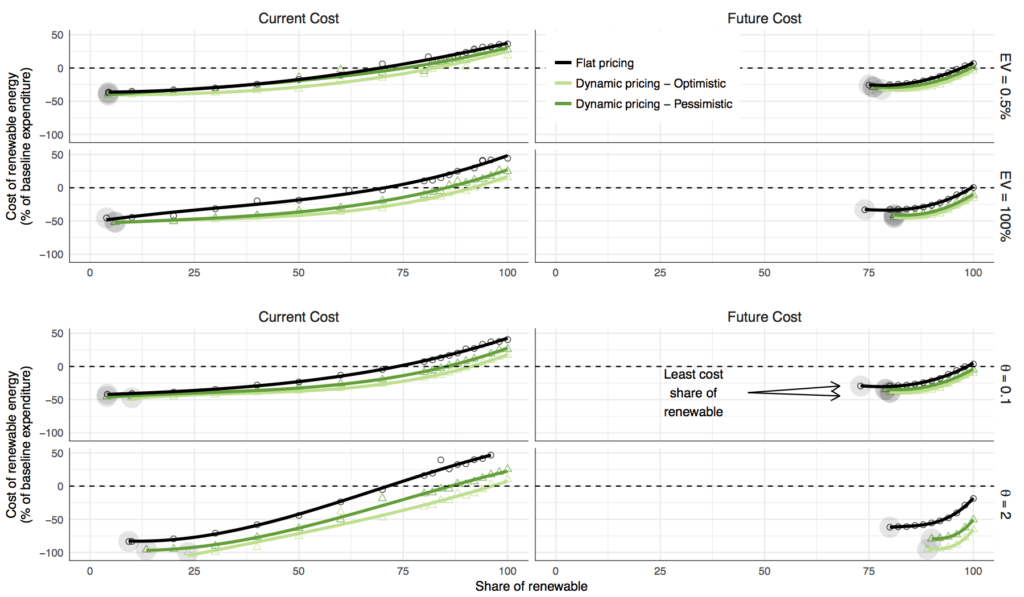
Consistent with earlier studies, the authors find that dynamic pricing provides little social benefit in fossil-fuel-dominated power systems, only 2.6 to 4.6 percent of baseline annual expenditure. But dynamic pricing leads to a much greater social benefit of 8.5 to 23.4 percent in a 100 percent renewable power system with otherwise similar assumptions, even if the overall demand for electricity is inelastic (0.1). If overall demand for electricity is elastic (2.0), the social benefits of renewable energy are even greater, and variable pricing can improve welfare by as much as 47 percent of baseline expenditure.
When fully optimized, future high renewable systems, including 100 percent renewable, are remarkably affordable. The welfare maximizing (unconstrained) generation portfolio under the utility’s projected 2045 technology and pessimistic interhour demand flexibility uses 79 percent renewable energy, without even accounting for pollution externalities. This optimized share is over 80 percent with more elastic and/or flexible demand, and the cost of growing the share of renewables above this optimum is fairly modest until the last 5 to 10 percent of fossil fuels are eliminated.
Hawai‘i has a natural advantage in adoption of large shares of renewable energy, with plentiful renewable resources and expensive conventional generation. However, the intermittency challenge is especially acute in Hawai‘i, due to the state’s geographic concentration. In continental regions, transmission provides a potentially low-cost alternative to storage and demand response for managing intermittency challenges, as well as transferring renewable power from areas rich in renewable resources to areas that are renewable energy poor. The new modeling framework can assess the substitution possibilities between transmission and demand response, and optimize high-dimensional chronological power systems in a realistic way.

Notes: Each line shows the social cost—the loss in total economic surplus (PS + CS)—as the share renewable electricity rises above the least-cost share, holding all else the same. Social cost is measured as percent of expenditure in the baseline scenario, which is a predominantly fossil system with flat pricing in the year 2045. Thus, values less than zero imply a welfare improvement compared to using a conventional fossil system in the future (excluding externalities). Graphs on the left assume current (2016) costs, while graphs on the right assume future (2045) costs. Comparison of the top two rows shows the influence of electric vehicles (EV), contrasting the current fleet share of 0.5 percent EV with 100 percent EV. In the top two rows the overall demand elasticity is fixed at the baseline of θ = 0.1. Comparison of the bottom two rows shows the influence of a more elastic demand (θ = 2 versus θ = 0.1), while holding the EV share fixed at 50 percent. In all graphs, black lines show the social cost with flat prices; dark green line show the social cost with variable prices and pessimistic interhour substitutability; and the light green lines show social cost with variable prices and optimistic interhour substitutability.
BLOG POSTS ARE PRELIMINARY MATERIALS CIRCULATED TO STIMULATE DISCUSSION AND CRITICAL COMMENT. THE VIEWS EXPRESSED ARE THOSE OF THE INDIVIDUAL AUTHORS. WHILE BLOG POSTS BENEFIT FROM ACTIVE UHERO DISCUSSION, THEY HAVE NOT UNDERGONE FORMAL ACADEMIC PEER REVIEW.


