BLOG POSTS ARE PRELIMINARY MATERIALS CIRCULATED TO STIMULATE DISCUSSION AND CRITICAL COMMENT. THE VIEWS EXPRESSED ARE THOSE OF THE INDIVIDUAL AUTHORS. WHILE BLOG POSTS BENEFIT FROM ACTIVE UHERO DISCUSSION, THEY HAVE NOT UNDERGONE FORMAL ACADEMIC PEER REVIEW.
By James Mak and Justin Tyndall
The U.S. Census Bureau estimates that, between July 1, 2018 and July 1, 2019, Hawaii’s population decreased by 4,721. Hawaii was one of ten states to lose population. Hawaii has been losing population for three consecutive years beginning in 2017. Persistent decline in the state’s population may be an indication of an ailing state facing major economic and social problems. Population losses can directly affect political representation and can also dampen the state’s economy. [1]
A change in a state’s population can be attributed to changes in three population components: natural increase (i.e. births minus deaths), net immigration (from foreign countries), and net domestic migration. Between 2018 and 2019, Hawaii experienced a natural increase of 4,130 inhabitants; international migration added another 5,014; however, 13,817 more Hawaii residents moved to the U.S. mainland than mainland residents moved to Hawaii. (The numbers don’t add up exactly due to a residual that cannot be attributed to any specific demographic category.) [2] Net migration (to other states) swamped natural population increase and international net in-migration to produce a population loss in Hawaii. Twenty-one other states and the District of Columbia also saw more of their residents leave than new residents move in from other states. Among them, Hawaii had the highest rate of net out-migration per 1000 inhabits in 2019, followed by New York and Illinois. [3]
Hawaii residents have long been fascinated by how many people move to the U.S. mainland each year. Until the Census Bureau began to publish annual estimates of state-to-state population migration no one knew for sure. But it was not a secret among locals that large, albeit unknown, numbers of the state’s population were leaving the islands since the mid-1970s for the affordability and glitz of Las Vegas, Nevada, affectionately known as Hawaii’s 9th Island. [4] To put a number on how many people were leaving the state, University of Hawaii-Manoa economist Walter Miklius—who himself would later retire to the Mainland—examined the Health Department’s health surveillance survey for 1990 that included a question on how likely—“some possibility”, “a good chance”, or “almost certain”—the respondent will be living some place other than Hawaii one year hence. There was no follow-up survey to confirm that the respondent actually moved. Using heroic assumptions on the probability of actually moving, Miklius came up with an estimate of 21,740 Hawaii residents who left Hawaii in 1990, or about 2% of the entire Hawaii population. [5] The Health Department survey didn’t ask potential movers where they might be moving to. Miklius did not analyze in-migration to Hawaii.
We now have better data on state-to-state migration flows derived from the annual American Community Survey (ACS). The ACS is the largest household survey in the U.S; like the decennial census long form it is also mandatory. [6] Among a long list of questions, the survey asks respondents where they actually lived a year ago. The Census Bureau uses the ACS data to estimate population migration between states and localities. At this writing, state-to-state migration data separately for in-migration and out-migration are available through 2018. [7] Figure 1 displays state-to-state population flows between Hawaii and the U.S. mainland, 2006 to 2018. (The data are displayed in the Appendix, Table A-1.)
Figure 1
In 2018, 67,293 Hawaii residents moved to the Mainland, or equivalent to more than 4.5% of the state’s total population; they were partially replaced by 54,074 mainlanders who moved to Hawaii for a net out-migration from Hawaii of 13,219.
People move for personal/family and economic/employment reasons. [8] Those who choose to move consider themselves better off by moving. For the economy, migration is one way the labor market adjusts to business cycles and external shocks. For example, absent migration, the labor market’s response to a sharp economic recession is a (steeper than otherwise) rise in unemployment and probably a fall in labor force participation. Migration absorbs some of the shock, which is good for those who stayed. In the long run, sustained net out-migration reduces the state’s human capital and retards economic growth.
For Hawaii, Figure 1 indicates that through good times and bad (including the Great Recession which began in 2007), more Hawaii residents moved to the Mainland since 2006 than mainlanders moved to Hawaii each year, except in 2010. By contrast, the state’s population increased every year until 2017. Natural population increase and (international) immigration more than off-set negative net resident out-migration to the Mainland. Hawaii’s population declined since 2016 in part due to increases in out-migration but also because of decreases in the number of in-migrants from the Mainland. The Mainland has become a more attractive place to live for many Hawaii residents while Hawaii has become less attractive for potential Mainland in-migrants.
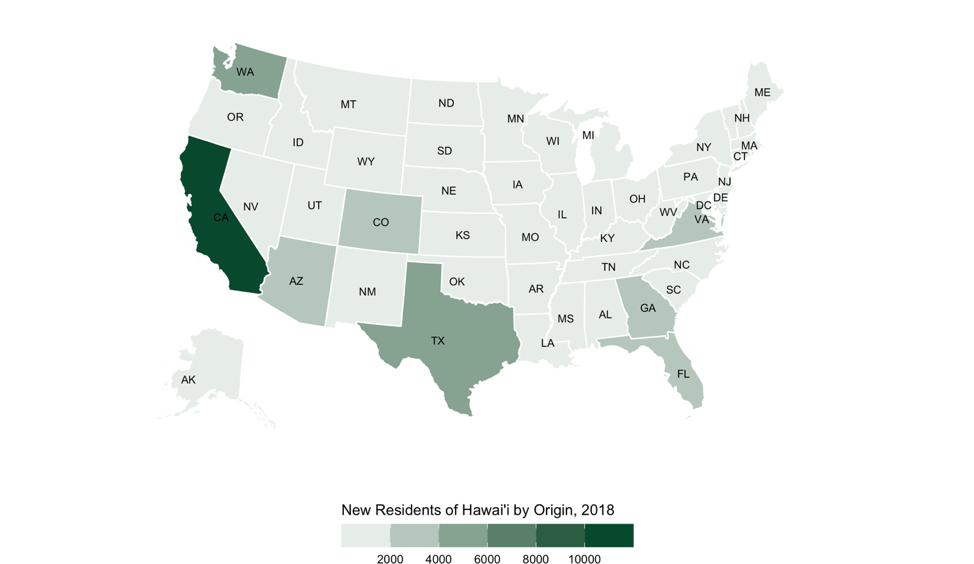
Which states did Hawaii’s out-migrants move to in 2018? And which states did Hawaii’s in-migrants come from? The answers can be found in the following maps. (See Appendix Table A-2 for the data.)
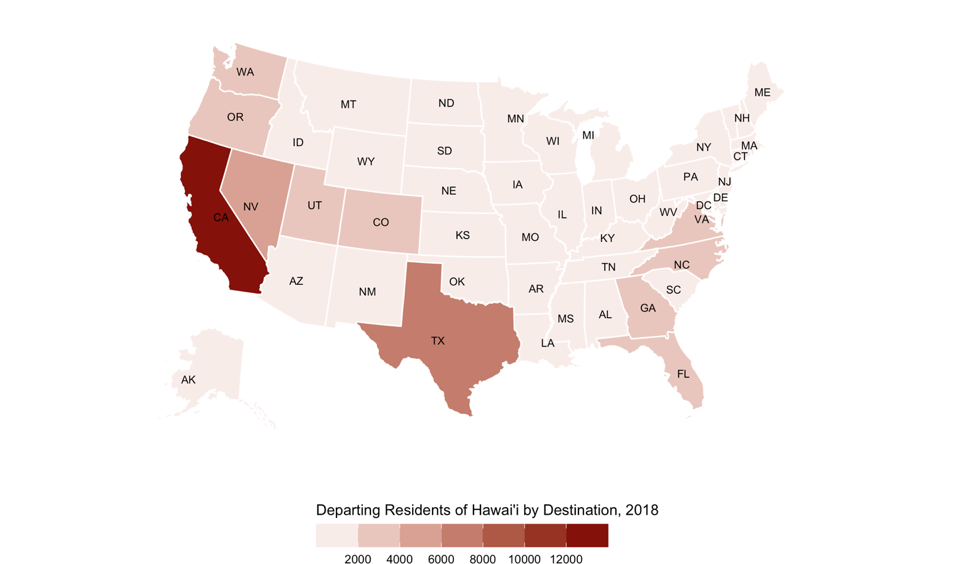
The number one destination of Hawaii residents moving to the U.S. mainland in 2018 was California (12,848) followed by Texas (7,986), Nevada (4,959), Washington (3,416) and North Carolina (3,402) round out the Top Five destinations. Together, they accounted for 42% of all Hawaii emigrants to the Mainland.
Among new comers to Hawaii, the number one source was also California (10,456), followed by Washington (4,351), Texas (4,180), Virginia (3,987) and Colorado (3,164). These five states accounted for 48% of total Mainland in-migrants to Hawaii in 2018. Although there is geographic dispersion, migration to and from Hawaii is concentrated among a relatively few states.
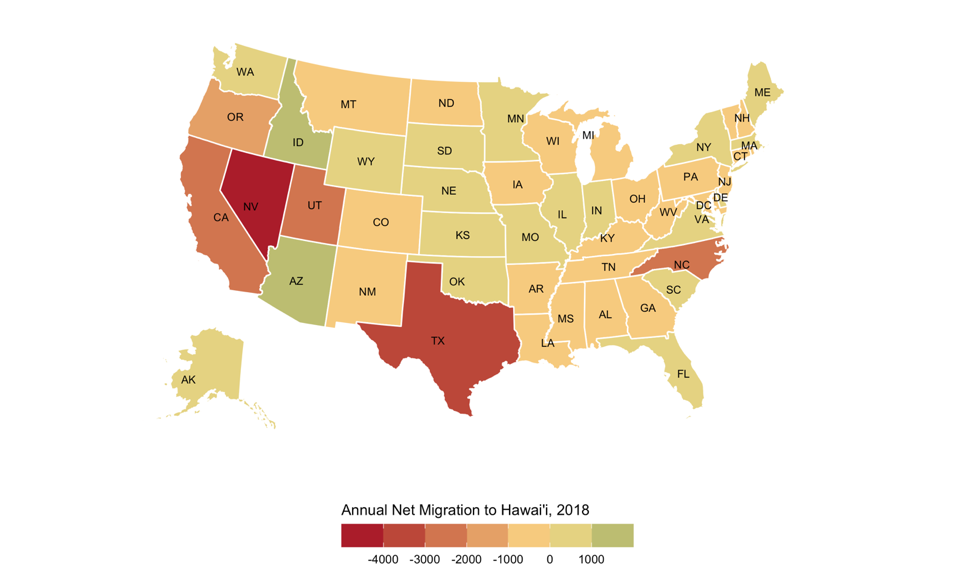
The third map shows net-migration by state. Even though California is the number one destination of Hawaii residents moving to the Mainland and the number one source of new Hawaii residents from the Mainland, it is not the lead state when it comes to net migration. That distinction belongs to Nevada.
COVID-19 and efforts to contain it no doubt will drastically stem the flow of migrants between Hawaii and the U.S. mainland, at least temporarily. We won’t know how drastically until the Census Bureau releases state-to-state migration data during the pandemic period. During and shortly after the Great Recession fewer people moved to and (especially) out of Hawaii (see Figure 1). Hawaii’s travel-dependent economy took a huge hit even before the 14-day travel quarantines, business shutdowns and stay-at-home orders. One might expect the resultant spike in unemployment would spur a surge in out-migration to the Mainland. But that might not happen immediately due to the greatly increased difficulty of navigating a trans-Pacific move. There is also the public’s fear of getting infected on the Mainland where the pandemic is worse in many parts of the country than in Hawaii, especially in states like California and Texas, destinations that are popular among Hawaii residents. The impact of reduced out-migration falls on the labor market with likely more workers leaving the labor force and higher unemployment rates (among those who remain in the labor force) than would be otherwise.
In the early 1970s, many in Hawaii were concerned that too many people were moving to Hawaii and reducing the quality of life in the islands. In recent years locals are leaving the islands in increasing numbers, citing the high cost of living in Hawaii—especially housing costs—and the lack of job opportunities suited to their skills and interests. There is still much to be learned about why so many kama’aina move to the Mainland, and vice versa, and the economic, social, political and demographic implications of this two-way migration.
Appendix
Table A-1
Domestic Migration Into and Out of Hawaii: 2006-2019
| Year | (1) In-Migration | (2) Out-Migration | (3) = (1) – (2) Net-Migration |
| 2006 | 60,825 | 72,333 | -11,508 |
| 2007 | 51,973 | 66,468 | -14,495 |
| 2008 | 55,491 | 56,356 | -865 |
| 2009 | 53,270 | 64,417 | -11,147 |
| 2010 | 53,581 | 49,218 | +4,363 |
| 2011 | 57,542 | 61,940 | -4,398 |
| 2012 | 55,145 | 61,509 | -6,364 |
| 2013 | 58,083 | 60,437 | -2,354 |
| 2014 | 58,144 | 60,739 | -2,595 |
| 2015 | 53,742 | 60,459 | -6,717 |
| 2016 | 57,229 | 64,119 | -6,890 |
| 2017 | 46,457 | 66,597 | -20,140 |
| 2018 | 54,074 | 67,293 | -13,219 |
| 2019 | -13,817 | ||
| Sources: https://www.census.gov/data/tables/time-series/demo/geographic-mobility/state-to-state-migration.html; State of Hawaii Data Book, various years from 2011 to 2018 | |||
Table A-2
Hawaii Migrants from and to U.S. States and D.C.: 2018
| State | (1) In-migration From | (2) Out-migration To | (3) = (1) – (2) Net Migration |
| Alabama | 484 | 627 | -143 |
| Alaska | 1,509 | 1,029 | +480 |
| Arizona | 2,067 | 591 | +1,576 |
| Arkansas | 0 | 468 | -468 |
| California | 10,456 | 12,848 | -2,392 |
| Colorado | 3,164 | 3,356 | -192 |
| Connecticut | 114 | 472 | -358 |
| Delaware | 52 | 0 | +52 |
| District of Columbia | 768 | 124 | +644 |
| Florida | 3,085 | 3,008 | +77 |
| Georgia | 2,192 | 2,335 | -143 |
| Hawaii | — | — | — |
| Idaho | 1,027 | 0 | +1,027 |
| Illinois | 583 | 459 | +124 |
| Indiana | 306 | 47 | +259 |
| Iowa | 586 | 689 | -103 |
| Kansas | 1,385 | 564 | +821 |
| Kentucky | 170 | 402 | -232 |
| Louisiana | 320 | 1,117 | -797 |
| Maine | 124 | 55 | +69 |
| Maryland | 574 | 892 | -318 |
| Massachusetts | 656 | 257 | +399 |
| Michigan | 115 | 496 | -381 |
| Minnesota | 363 | 241 | +122 |
| Mississippi | 219 | 489 | -270 |
| Missouri | 1,129 | 322 | +807 |
| Montana | 165 | 225 | -60 |
| Nebraska | 481 | 420 | +61 |
| Nevada | 502 | 4,959 | -4,457 |
| New Hampshire | 0 | 151 | -151 |
| New Jersey | 24 | 305 | -281 |
| New Mexico | 122 | 313 | -191 |
| New York | 1,416 | 1,181 | +235 |
| North Carolina | 843 | 3,402 | -2,559 |
| North Dakota | 0 | 204 | -204 |
| Ohio | 510 | 735 | -225 |
| Oklahoma | 1,172 | 931 | -241 |
| Oregon | 1,615 | 2,729 | -1,114 |
| Pennsylvania | 580 | 783 | -203 |
| Rhode Island | 0 | 0 | 0 |
| South Carolina | 1,072 | 857 | +215 |
| South Dakota | 50 | 0 | +50 |
| Tennessee | 723 | 1,515 | -792 |
| Texas | 4,180 | 7,986 | -3,806 |
| Utah | 413 | 2,533 | -2,120 |
| Vermont | 0 | 98 | -98 |
| Virginia | 3,987 | 3,116 | +871 |
| Washington | 4,351 | 3,416 | +935 |
| West Virginia | 0 | 42 | -42 |
| Wisconsin | 142 | 449 | -307 |
| Wyoming | 178 | 55 | +123 |
| Source: https://www.census.gov/data/tables/time-series/demo/geographic-mobility/state-to-state-migration.html Note: Data are based on a sample and subject to sampling variability. | |||
1 Robert Gebeloff, “Why Your State Is Growing or Stalling or Shrinking,” The New York Times, January 9, 2020 at https://www.nytimes.com/2020/01/09/upshot/american-population-slowdown.html
2 U.S. Census Bureau at https://www.census.gov/data/tables/time-series/demo/popest/2010s-state-total.html#par_textimage_1574439295
3 https://en.wikipedia.org/wiki/List_of_U.S._states_and_territories_by_net_migration
4 Jessica Terrell, Ku’u Kauanoe and Claire Caulfield, “How Las Vegas Became Hawaii’s 9th Island,” Honolulu Civil Beat, June 14, 2020 at https://www.civilbeat.org/2020/06/how-las-vegas-became-hawaiis-9th-island/
5 Walter Miklius, “If Hawaii is paradise, why do so many people leave?” Randy W. Roth (editor), The Price of Paradise, Lucky We Live Hawaii? Mutual Publishing, 1992, Chapter 36.
6 U.S. Census Bureau, American Community Survey, Information Guide, October 2017at https://www.census.gov/content/dam/Census/programs-surveys/acs/about/ACS_Information_Guide.pdf
7 https://www.census.gov/data/tables/time-series/demo/geographic-mobility/state-to-state-migration.html
8 https://www.census.gov/data/tables/2019/demo/geographic-mobility/cps-2019.html