By Sherilyn Wee
We hear a lot about Hawaii’s Renewable Portfolio Standard (RPS) which requires 100% of the utilities’ net electricity sales to come from renewable sources by 2045. Subsidies, rapidly declining solar panel costs, and high electricity prices have led to the proliferation of distributed rooftop solar photovoltaic (PV). By the end of 2016, roughly 1 out of 7 occupied housing units on Oahu had a solar PV system (City and County of Honolulu, 2017; ACS, 2017). Integrating increasing amounts of intermittent renewable energy, including utility-scale solar and wind, presents a challenge for electricity grid operators since at any moment supply must equal demand. While it is easy to get wrapped up in how to enable more cost-effective renewable energy on an outdated grid, designed for centralized generation and a one-way flow of electricity, I’d like to step back for a moment and remind ourselves of the rationale for renewable energy policies to ensure we meet our policy objectives and, towards that end, are using the appropriate policy instruments.
Like the U.S., Hawaii relies heavily on fossil fuels to meet its electricity needs (see Figure 1 for Hawaii’s generation mix in 2016) 1. Since fossil fuels are a depletable resource, the transition to renewable energy is theoretically inevitable absent any policy intervention. It is the speed of transition that is inefficient from a social perspective due to the presence of environmental externalities (Gillingham and Sweeney, 2010) 2. The damages from greenhouse gas (GHG) emissions are spillover costs not reflected in current market prices for fossil fuels. As a result, there is both more fossil fuel consumption than socially optimal and the transition time to renewable energy is slower. Basic economics tells us that the best way to mitigate climate change is to “get prices right” by imposing a tax equal to the marginal damage cost of emissions or apply emissions trading 3. Such market-based incentives are less costly and allow for more flexibility than traditional command-and-control policies in which uniform standards (ambient, emissions, or technology) must be met by affected sources. The marginal damage cost of GHG emissions can be given by the “social cost” of carbon—the per unit present value of the total damages from carbon dioxide (CO2) emissions or alternatively the benefit from emissions abatement.
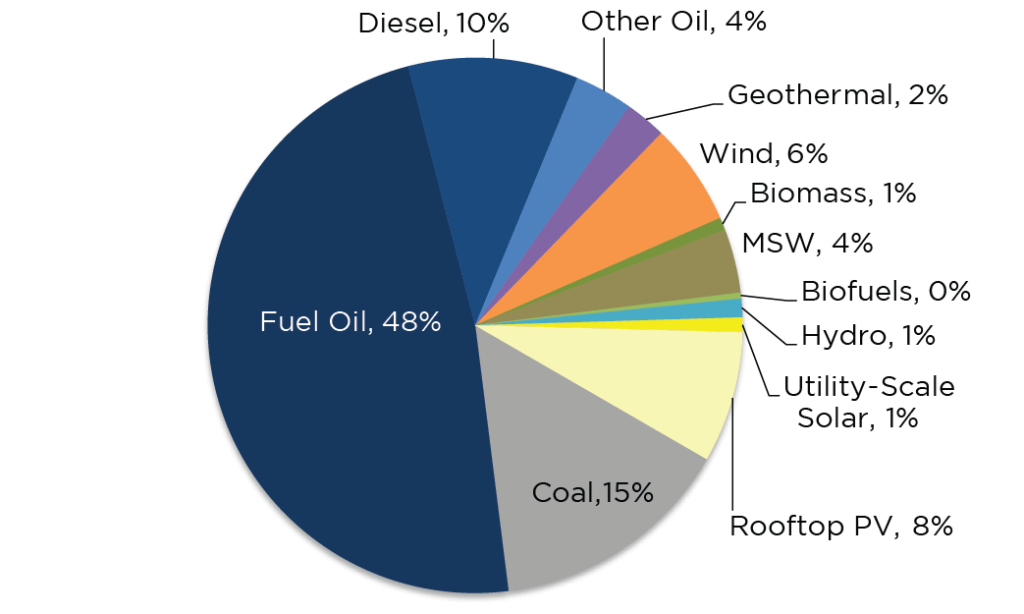
Source: EIA, 2017.
Instead of a broad carbon tax, most of the focus in Hawaii has been on taxing the barrel of oil. This of course also discourages fossil fuel use; however, the barrel tax we have is quite modest so its major impact is as a source of funding. As only $1.05 per barrel is levied—and this excludes aviation fuel and fuel sold to a refiner—it does not capture the full externality cost. And the dirtiest fuel, coal, is also currently exempted 4. We also rely on policy instruments like the RPS or subsidies for renewable energy, which though they likely reduce carbon, not necessarily at least-cost 5. These policies were not founded on the basis of environmental impacts (namely climate change), but instead were primarily driven by affordability 6 and a stronger local economy 7.
To address climate change specifically, we have a separate policy, Act 234 (2007), which requires Hawaii to reduce its GHG emissions to 1990 levels by 2020. The statewide GHG limit is 13.66 million metric tons of carbon dioxide equivalent (MMTCO2e), excluding air transportation and international bunker fuel emissions and including carbon sinks. In response, GHG rules were established for the electricity sector in 2014; facilities emitting over 100,000 tons of CO2e per year (excluding municipal waste combustion operations and municipal solid waste landfills) are required to reduce emissions by 16% from 2010 levels in 2020. Partnering across the 20 affected facilities is allowed to achieve cost-effective emissions reduction.
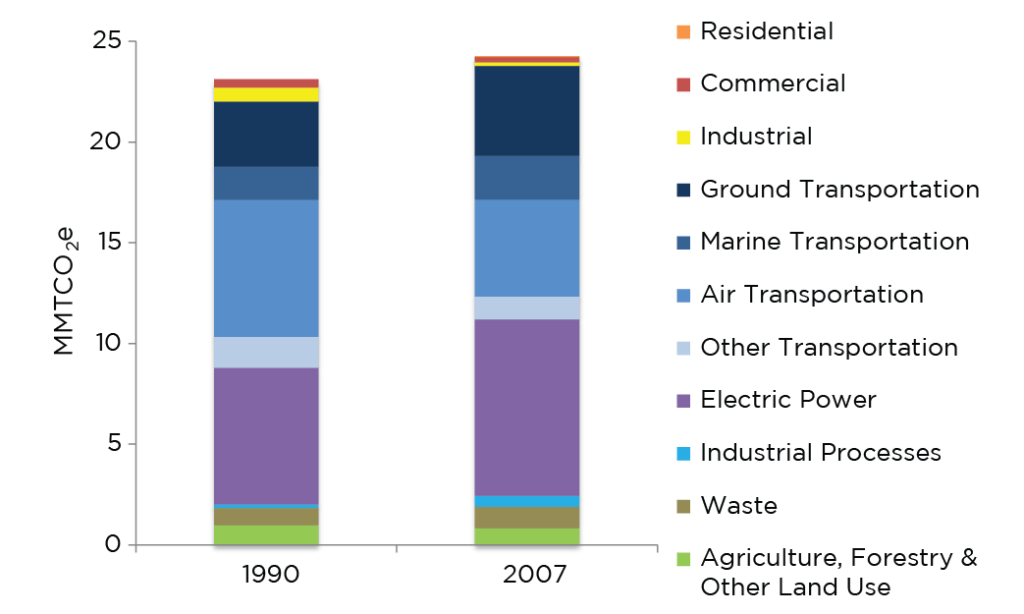
Source: ICF, 2008.
Figure 2 shows Hawaii’s 1990 and 2007 GHG emissions inventory—the most recent inventory to date 8. It shows that the electricity sector produces approximately 30% of GHG emissions. Other sectors matter too, especially transportation. By focusing on economy-wide GHG emissions reduction, coupled with the appropriate policy instrument to meet the policy objective, not only will it encourage more renewable energy in the electricity sector, but it will also facilitate coordinated efforts in other sectors. For instance, ground transportation comprises many individual actors, which together account for 14-18% of emissions. It is also the fastest growing sector (38% increase between 1990 and 2007). Emissions from ground transportation have likely continued to increase despite increased fuel efficiency and the growth of electric vehicles (EVs) in recent years 9. This suggests that even if the electricity sector were to comply with or exceed the 16% reduction, the growth of ground transportation likely outpaces the decline in the electricity sector; without coordinated state action we may not meet Act 234 10.
Climate change policy offers a potentially economy-wide approach that can align multiple policy goals—whether it is more affordable, locally produced electricity or the electrification of transportation. An economy-wide carbon tax also means that the same $/ton cost would be levied on gasoline. While there is a federal gasoline tax of 18.4 cents/gallon and a state gasoline tax of 16 cents/gallon (EIA, 2017), this does not necessarily amount to the full externality cost of pollution 11. With the proper price signals, getting more EVs on the road will happen without any other overarching goals or mandates in the transportation sector. Whereas federal Corporate Average Fuel Economy (CAFE) standards increase the fuel efficiency of new vehicles, they do not encourage people to drive less. A carbon tax would target both vehicle purchase and driving decisions for new and used vehicles. Moreover, a carbon tax offers the opportunity to address distributional impacts. Carbon taxes are perceived to be regressive because fuel comprises a greater share of spending for low-income households. However, mandates are more regressive than a revenue-neutral carbon tax which can redistribute revenues to taxpayers by cutting other taxes (e.g. payroll, personal income, and corporate taxes) or through direct payments (flat “check in the mail”) 12.
Lastly, a carbon tax would also address flaws in today’s current energy policies. For instance, the 100% RPS, as currently calculated, does not translate into Hawaii generating all its electricity from renewable sources since distributed rooftop PV is counted in the numerator (renewable generation) but not in the denominator (total electricity sales). As calculated, only electric utilities are subject to the law. The gas utility and other large commercial customers who install their own generators are not part of the picture, perhaps prompting large customers to switch to gas or defect from the grid entirely. Instead of devising an amended metric to close such loopholes, 13 stronger GHG policy—a carbon tax to either complement or replace the RPS—would align statewide goals and avoid the consequences of any “leakage” across sectors.
A carbon tax could also help to make good on the goals of Hawaii’s energy efficiency portfolio standards (EEPS). In contrast to an RPS which targets the supply-side, the EEPS focuses on electricity consumption, calling for a 30% reduction by 2030, equivalent to 4,300 gigawatt hours based on a 2008 baseline forecast of electricity consumption in 2030. Measuring progress according to the design of the standard is extremely difficult without a “counterfactual”—that is, electricity consumption absent any energy efficiency savings. In addition, similar to CAFE standards in the transportation sector, some efficiency gains are offset by increased consumption (a rebound effect). There are also many individual actors, some regulated by the Public Utilities Commission, and others, unregulated. An economy-wide carbon tax would incent fossil fuel conservation by all. Note also the volumetric surcharge design to support energy efficiency programs currently presents regressive impacts 14.
There’s a lot of background activity around compliance with Act 234 on the horizon with affected facilities submitting their updated emissions reductions plan and the DOH updating and developing GHG inventories and projections. As we move forward, we should consider not only working towards compliance in one year but in perpetuity. This blog post has highlighted the critical link between our broader energy goals and how climate change policy and its policy instruments can enable us to reach those objectives. Maybe Act 32 (2017), which commits Hawaii to meeting some of the principles and goals laid out in the Paris Accord, will be a way to keep us on track. But without any specifics as to how we are to achieve such reductions—through a carbon tax or otherwise—it is largely symbolic. It’s time for a comeback in energy and GHG policymaking.
BLOG POSTS ARE PRELIMINARY MATERIALS CIRCULATED TO STIMULATE DISCUSSION AND CRITICAL COMMENT. THE VIEWS EXPRESSED ARE THOSE OF THE INDIVIDUAL AUTHORS. WHILE BLOG POSTS BENEFIT FROM ACTIVE UHERO DISCUSSION, THEY HAVE NOT UNDERGONE FORMAL ACADEMIC PEER REVIEW.
[1] Though the composition of fossil fuels differs; in the U.S., natural gas and coal comprise roughly 30% each and nuclear, 20% in 2016 (EIA, 2017).
[2] Yet with technological advances and the discovery of new reserves, it could also be argued that the supply of fossil fuels are “nearly limitless.” In either case, without correcting for the market failure, the transition would be to slow to mitigate the impacts of climate change (Covert et al., 2016).
[3] For instance, the Regional Greenhouse Gas Initiative, is an electric sector cap-and-trade program between nine Northeastern States.
[4] See Act 73 (2010), Act 107 (2014), and Act 185 (2015).
[5] Emissions reduction depends on the generation source displaced and on increased consumption due to reduced prices. Murray et al. (2014) show tax credits have a small impact on GHG emissions, and in some cases, emissions increase. Palmer and Burtraw (2005) show that neither a production tax credit or an RPS leads to as high of and as cost-effective a reduction as a cap-and-trade program.
[6] Note low cost and renewable energy is often incorrectly regarded as synonymous; such treatment depends on context (e.g. PV versus non-PV customers) and the procurement of renewable energy sources (benefit from low-cost utility-scale renewables is shared amongst all customers). Also, if Oahu’s coal plant—the cheapest source of energy at around 3 cents/kWh—were to go offline (power purchase agreement to expire in 2022), energy costs would increase dramatically.
[7] See HB1464 (2009) and HB623 (2015).
[8] The Department of Health (DOH) is in the process of updating prior GHG inventories and developing new GHG inventories for 2015, 2016, and 2017.
[9] There are 6,490 EVs statewide, comprising less than 0.01% of all registered passenger vehicles as of October 2017 (DBEDT, 2017).
[10] Contrary to the Department of Health’s (2014) statement that “these rules will ensure that the state returns to 1990 GHG emission levels by 2020 as required under Act 234, 2007.”
[11] GHG emissions are a global pollutant and therefore global damages should be accounted for.
[12] See for example David and Knittel (2016) and Levinson (2016) on fuel economy standards.
[13] In the 2017 legislative session, the Department of Business Economic Development and Tourism (DBEDT) for the second time, proposed to amend the RPS calculation to correct for this error (see SB906, HB1040).
[14] As a per kWh charge, customers who are able to reduce or offset their energy use through energy efficiency and distributed PV pay a lower dollar amount than customers who do not have access to such technology. The expansion of distributed PV puts a greater burden on these (generally) lower-income customers.