HOW WILL THE PROPOSED 400 MW WIND ENERGY PROJECT CONTRIBUTE TO THE STATE’S RENEWABLE ENERGY GOALS?
Hawaii has one of the most stringent Renewable Portfolio Standard (RPS)* policies in the country as well as the highest electricity rates due to dependence on oil for electricity generation (Coffman et al., 2012). As such, renewable energy technologies like wind tend to be more cost-effective in Hawaii than elsewhere in the U.S.
After the signing of the Memorandum of Understanding between the State of Hawaii and the U.S. Department of Energy, the Hawaii Clean Energy Initiative, Hawaii increased its’ RPS law to achieve 40% of electricity sales based on renewable energy sources by the year 2030. It specifies that:
- 10% of net electricity sales be based on renewable energy sources by the end of 2010,
- 15% by 2015,
- 25% percent by 2020, and
- 40% by 2030.
Renewable fuel/energy types include solar, wind, ocean, geothermal, biomass-based, landfill gas, hydroelectric, CHP/cogeneration, hydrogen, anaerobic digestion, and waste. In the year 2015, energy efficiency ceases to count as a “renewable” energy type and will instead be governed by an Energy Efficiency Portfolio Standard (EEPS).
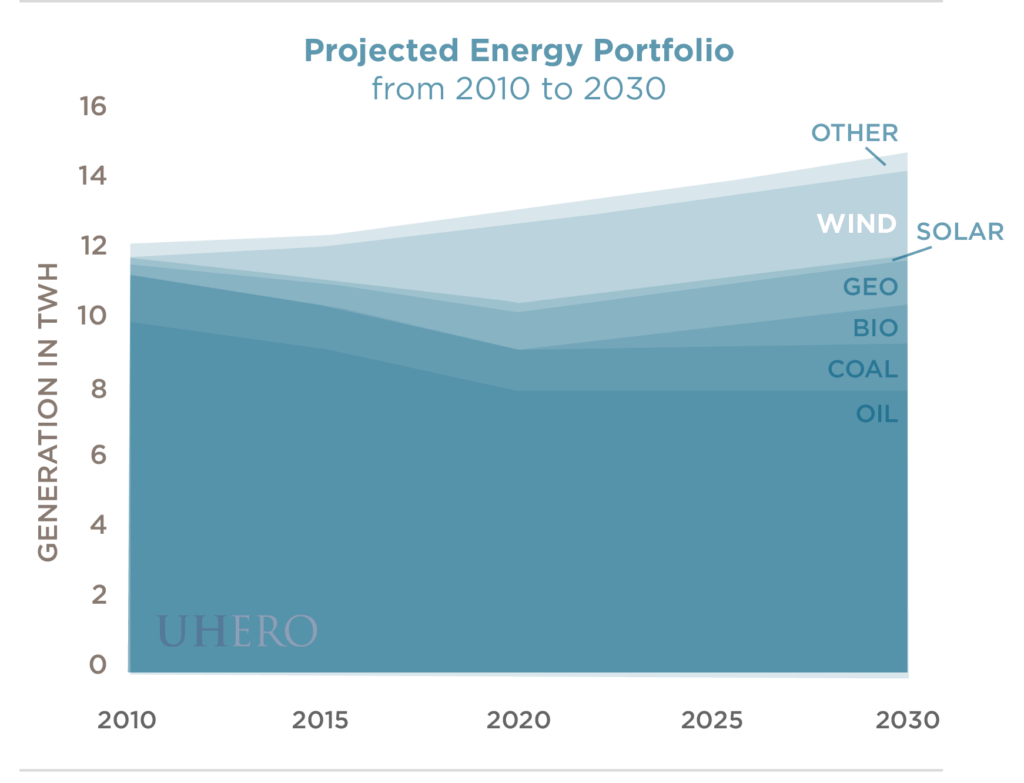
Using a model of Hawaii’s electric sector, we find that the proposed 400MW wind project will meet about 10% of the State’s energy needs in the year 2030. Figure 1 shows Hawaii’s possible energy mix from 2010 to 2030. The figure represents a scenario where:
- the least-cost mix of electricity generation is selected assuming that the 400MW
- wind project is built in the year 2020,
- fuel prices (oil, coal and bio-oil) follow the Energy Information Administration’s (EIA) reference trend, and
- the RPS law is met.
It is important to note that the RPS does not govern the use of the other 60% of fossil fuels (which remains oil-dominated)** nor does it distinguish between types of renewable energy (see Coffman, Griffin and Bernstein, 2012). For example, biofuels are counted similarly to solar photovoltaic or wind energy, even though their net energy content and greenhouse gas emissions impacts are quite different. The proposed wind project largely serves to limit the amount of imported biofuel used to meet the RPS.***
DOES THE PROPOSED 400 MW WIND ENERGY PROJECT MAKE ECONOMIC SENSE?
Using both the model of Hawaii’s electric sector and one of Hawaii’s overall economy, we find that moving forward with the proposed 400 MW wind project has net benefits to Hawaii’s economy because of a positive terms of trade effect. Fundamentally, wind energy serves as a “hedge” against potentially rising and volatile fuel prices, including biofuel prices. Biofuel prices are highly linked to oil due to their high level of substitutability. Even when fossil fuel and biofuel prices are expected to be low (according to the EIA’s Annual Energy Outlook 2012), the proposed wind project retains its net macroeconomic benefits, albeit quite small. We find that the project has a net positive impact of $589 million (in $2007 Gross State Product) over the 20-year model time horizon, translating to an impact of $2.80 per year to households.
Although the economic impacts are relatively small (never over half a percent increase in Gross State Product on an annual basis) they are clearly positive through the model time horizon.
WILL THE PROPOSED 400 MW WIND ENERGY PROJECT REDUCE HAWAII’S GHG EMISSIONS?
The proposed project serves to reduce Hawaii’s net GHG emissions by about 10 million metric tons of CO2 over a 20-year time horizon. This is a roughly 4% reduction in electric-sector emissions.
– Makena Coffman
Coffman, M. and Bernstein, P. (2012). “An Integrated Top-Down and Bottom-Up Analysis of Wind Energy.” Prepared for AUBER 2012, Honolulu, HI.
Coffman, M., Griffin, J., and Bernstein, P. (2012). “An Assessment of Greenhouse Gas Emissions-Weighted Clean Energy Standards,” Energy Policy, 45: 122-132.
* Renewable Portfolio Standards are a mandate placed on electric utilities that require a specified percentage of electricity sales be met through renewable sources of electricity by a certain year.
**The model represents all current laws and financial incentives for commercially available technologies. For example, the solar photovoltaic federal and state tax credits are accounted for to the extent that they are currently written into law. The exception, however, is coal. Although there is no law explicitly prohibiting the growth of coal use in Hawaii, we exclude more coal in this scenario because the Hawaiian Electric Company has publicly stated its commitment to limiting future use of coal. The full paper shows a wider array of scenarios.
***We assume that biofuels are imported because of the least-cost framework. It is certainly possible that locally produced biofuels are used to meet the RPS, but at a price premium.