


BLOG POSTS ARE PRELIMINARY MATERIALS CIRCULATED TO STIMULATE DISCUSSION AND CRITICAL COMMENT. THE VIEWS EXPRESSED ARE THOSE OF THE INDIVIDUAL AUTHORS. WHILE BLOG POSTS BENEFIT FROM ACTIVE UHERO DISCUSSION, THEY HAVE NOT UNDERGONE FORMAL ACADEMIC PEER REVIEW.
By Christopher A. Wada, Kimberly M. Burnett , Brytne K. Okuhata, Jade M. S. Delevaux, Henrietta Dulai, Aly I. El-Kadi, Veronica Gibson, Celia Smith, Leah L. Bremer
An interdisciplinary team from UHERO, the Water Resources Research Center, Dept. of Earth Sciences, and the Dept. of Botany recently published new scientific results in the journal PLOS ONE entitled, “Identifying wastewater management tradeoffs: costs, nearshore water quality, and implications for marine coastal ecosystems in Kona, Hawai’i.” Hawai‘i has become an important focal point for wastewater management due to increasing concern about threats to coral reef ecosystems of high value for tourism, recreation, fisheries, and cultural connection to place. There are approximately 88,000 cesspools across the state, releasing over 200,000 m3 of wastewater per day to the environment. Much of that wastewater percolates into underlying groundwater systems and eventually enters nearshore marine ecosystems via submarine groundwater discharge (SGD). In response to concerns that cesspools pose environmental and public health risks, in 2017 the Hawai‘i State Legislature passed Act 125, which requires that all cesspools in the State, unless granted exemption, be upgraded to a septic or aerobic treatment unit (ATU), or connected to a sewer system by January 1, 2050. A Cesspool Conversion Working Group (CCWG) was established in the following year under Act 132 to assist in facilitation of Act 125.
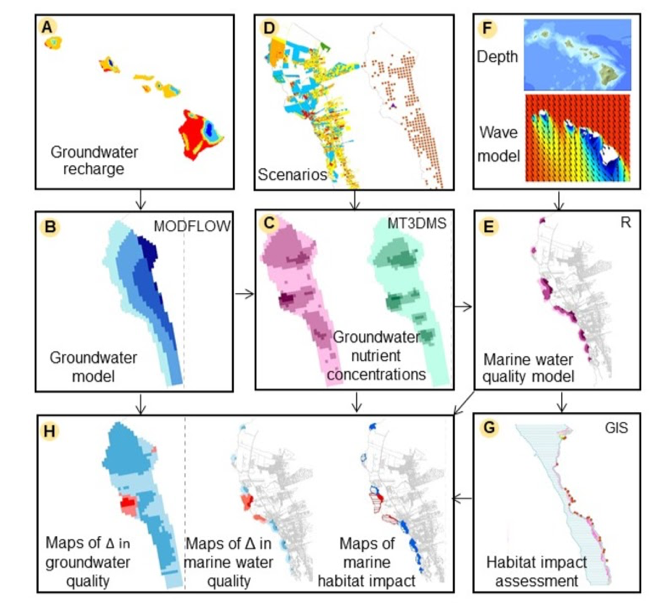
Of those 88,000 cesspools, 6,500 have been identified by the State Department of Health in the coastal Kailua-Kona area alone as having the potential to negatively impact coastal water quality and linked groundwater-dependent ecosystems (GDE). GDEs have historically served as important sources of water and food to Kona’s coastal communities and continue to be highly valued today for their cultural uses and provision of a wide variety of ecosystem services. To address this issue, the research team developed a ridge-to-reef framework to evaluate the potential impacts of land use and wastewater management decisions on nearshore water quality and ecosystems along the Kona Coast. Three models (groundwater budget, groundwater nutrient concentration, marine water quality), coupled with an assessment of potential impacts to marine habitat (Fig 1), were used to evaluate several management scenarios.
In total, eight management scenarios were developed through an interactive discussion process with the CCWG with the goal of generating research results that provide utility to decision makers (Table 1). The first scenario describes present-day conditions, with none of the cesspools converted and the existing wastewater treatment plant (WWTP) not upgraded. The future permitted build out scenario simulates the case where land development occurs but no wastewater mitigation strategies are undertaken and all new development is served by the existing WWTP. The remaining six scenarios describe different wastewater management options under the assumption that the permitted build out occurs in the future. For the options with targeted conversion, risk scores determine whether cesspools in a particular area are converted to either septic or ATU systems.
Table 1. Description of wastewater management scenarios
| No. | Scenario name | Land use | Cesspool conversion | WWTP upgrade |
| 1 | Present | Current land use | None | No |
| 2 | Future permitted (inaction) | Addition of permitted development | None | No |
| 3 | All ATU upgrade (+ WWTP upgrade) | Current land use | All ATU (high efficiency) | Yes (90% mass load reduction) |
| 4 | WWTP upgrade | Addition of permitted development | None | Yes (90% mass load reduction) |
| 5 | Target low efficiency | Addition of permitted development | Targeted septic & ATU (low efficiency) | No |
| 6 | Target high efficiency | Addition of permitted development | Targeted septic & ATU (high efficiency) | No |
| 7 | Target low efficiency + WWTP upgrade | Addition of permitted development | Targeted septic & ATU (low efficiency) | Yes (90% mass load reduction) |
| 8 | Target high efficiency + WWTP upgrade | Addition of permitted development | Targeted septic & ATU (high efficiency) | Yes (90% mass load reduction) |
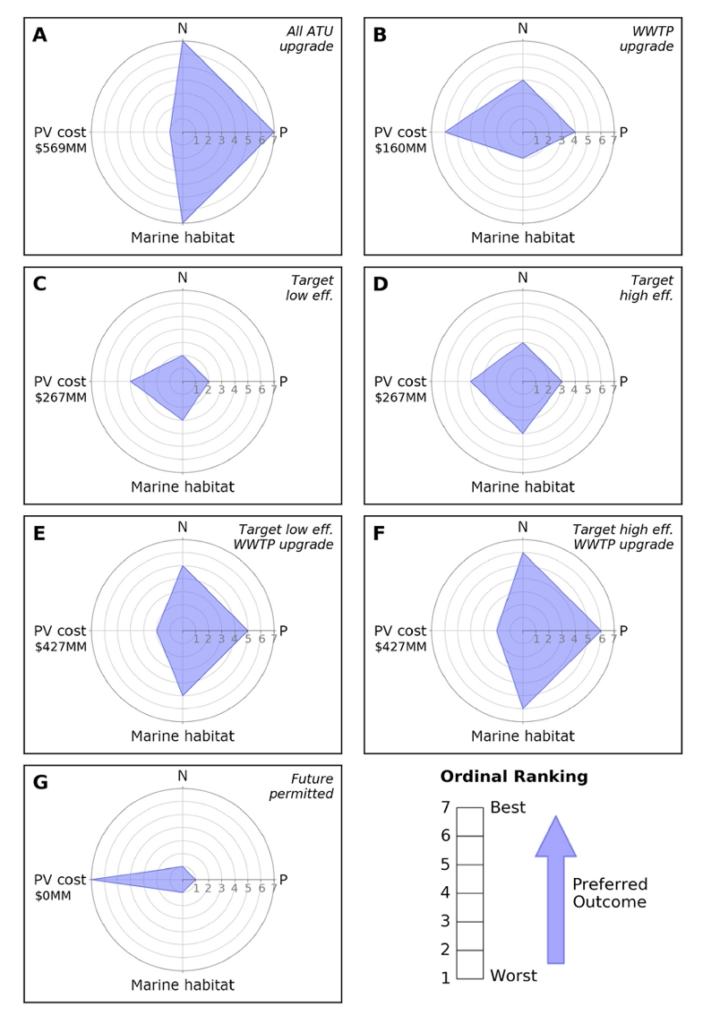
Without any upgrades of cesspools or the existing WWTP, discharges of nutrients are expected to increase substantially with permitted development, with potential detrimental impacts to the marine environment. Results suggest that converting all of the existing cesspools to aerobic treatment units (ATU) and upgrading the existing WWTP to R-1 quality provide the highest protection to nearshore marine habitat at a cost of $569 million in present value terms. Other wastewater management options were less effective but also less costly. For example, targeted cesspool conversion (a combination of septic and ATU installation) in conjunction with the WWTP upgrade still provided a substantial reduction in nutrients and potential impacts to marine habitat quality relative to the present situation at a price point roughly $100 million less than the entirely ATU option. Of note, results were more sensitive to the inclusion of the WWTP upgrade option than they were to assumptions regarding the efficiency of the cesspool conversion technologies. Fig 2 illustrates these tradeoffs.
The model outputs also suggest that the spatial distribution of potential impacts should be carefully considered when comparing different wastewater management scenarios. For example, potential habitat loss from upgrading the WWTP but leaving the cesspools in place is geographically very different from the potential consequence of upgrading the cesspools but leaving the WWTP as is. Upgrading the WWTP but leaving the cesspools in place moves potential marine habitat loss from the area surrounding the plant towards the south, while upgrading the cesspools while preserving the current WWTP technology shifts the majority of the potential marine ecological losses to the area immediately offshore of the WWTP. One takeaway from this analysis might be that concentrating exclusively on the cesspool conversions (per the language in Act 125) without concurrently improving the WWTP where all future permitted development will likely flow through may lead to suboptimal nutrient reductions and marine habitat outcomes.
Not all possible combinations of wastewater treatment technologies are considered here, as current Hawai‘i OSDS procedures, design criteria, standards, and restrictions are limited to septic tanks, ATUs, and absorption trenches/beds. More cost-effective and efficient alternatives have been implemented in other areas of the country and beyond, but such systems must be approved on a case-by-case basis by the State Department of Health. For example, layered soil treatment systems are a low maintenance disposal option with expected nitrogen removal in the range of 50 to 90 percent. If paired with a standard septic tank, nutrient removal efficiency could be on par with an ATU system at a fraction of the cost in certain areas. In some instances, decentralized cluster wastewater systems may also be a more cost-effective alternative than individual OSDS upgrades. However, there are several factors to consider: the number of (current) cesspool owners in the cluster that would connect to the decentralized wastewater system, terrain, land availability, and the funding mechanism. Because the optimal solution would likely require a portfolio of treatment technologies, one might interpret the results of this analysis as a base case that can be expanded upon in the future to consider emerging technologies as knowledge of such systems improve and as the state’s OSDS technology approval procedures continue to evolve.
When a suboptimal choice is selected among the kinds of scenarios presented here, resulting changes in coastal water quality and habitat quality may lead to reduced human enjoyment of some of Kona’s most prominent activities for residents and tourism industries, including nearshore snorkeling, scuba diving, shore fishing and spearfishing. In addition, such ecological changes can generate intangible costs for local residents, including unpleasant odors, as well as unappealing windrows of invasive species biomass that are costly nuisances and biological threats to native marine biota. Because the long-term biological consequences of excessive nutrient levels are generally not immediately reversible, careful consideration of such impacts is critical for coastal planning and management.
__
Acknowledgements: We are grateful to Stuart Coleman and Michael Mezzacapo of the Cesspool Conversion Working Group for continuing discussions about the state’s plans for achieving the goals set out in Act 125. We gratefully acknowledge Christin Reynolds, Roger Babcock, Rick Bennet, and partners at Wastewater Alternatives and Innovations (WAI) for sharing their knowledge about wastewater management policy, technologies, and costs. We also thank Kā‘eo Duarte for providing helpful feedback throughout the project.
6 thoughts on “Blog: Identifying wastewater management tradeoffs: costs, nearshore water quality, and implications for marine coastal ecosystems in Kona, Hawai’i”
Congratulations on your publication! I understand that many, if not most, septic systems in Hawaii are mismanaged and can be another source of groundwater contamination. Are there any ongoing discussions of how to upgrade the design of septic systems and better monitor their management? If the systems are well managed, they can conceivably make a positive contribution to the value of groundwater stocks.
Jim, thank you for your comment. Leakage is certainly a potential issue for many OSDS. Each system is typically comprised of a treatment component (e.g., septic tank, ATU) and a disposal component (e.g. absorption system, seepage pit). Both components require maintenance to operate properly, and contamination issues due to poor maintenance can be further exacerbated by external factors such as sea level rise (disposal systems near the coast will not work as intended if partially inundated). I’m not too familiar with the latest technological advancements of the tanks themselves, but there is a lot of ongoing research on how to improve the efficiency of disposal systems that are paired with the tanks. Regarding monitoring, my sense is that there are currently not enough State staff/resources to enforce an optimal maintenance schedule on a system by system basis. It would be interesting though to see whether the potential benefits (avoided contamination from existing poorly-maintained septic systems) would justify the costs of such a program and how that compares to simulated cesspool upgrade outcomes.
Thanks, Chris. Right; maintenance and enforcement are nontrivial problems. EPA recommends that “the average household septic system should be inspected at least every three years by a septic service professional.” A next step might be requiring users to upload maintenance records.
Jim
Thank you for all the research and information.
I had a question on the amount of wastewater being discharged into the ground.
I am not a mathematician so I am a little confused on the 18,000 gallons of WW per home.
The widely accepted rule of wastewater vs water bill is 80/20 rule. 20% goes to irrigation and non wastewater activities and 80% goes down the toilet. This would mean the average water bill would be about 23,000 gallons a month. Honolulu county and Maui county both average water usage at 9,000 gallons a month, and bill homeowners for 7,200 gallons a month sewage. How do we get to 2 1/2 times that for this report? Again, my math may be off, or I am missing something here, this is why I am reaching out.
Thank you
Lance, thank you for your comment and interest in our research. I think you are coming up with the 18,000 gal/mo by dividing the estimated 200,000 m3/day of effluent by the approximately 88,000 cesspools across the state and converting the units to gpm. Your math looks right. Our research team did not estimate the rate of effluent release in this project; we based the analysis on the numbers provided in a 2021 report to the State DOH, titled “Cesspool Conversion Technologies Research Summary Report” (https://health.hawaii.gov/wastewater/files/2021/02/technicalfinalreportr.pdf). Those numbers in the 2021 report, in turn, originated from a 2017 report prepared by the DOH in response to Act 125 (https://health.hawaii.gov/opppd/files/2017/12/Act-125-HB1244-HD1-SD3-CD1-29th-Legislature-Cesspool-Report.pdf). The estimated cesspool effluent discharge numbers presented in the 2017 report cite joint work by UH, DOH, and the EPA that was conducted back in 2009 and 2014, and the 2014 report (https://health.hawaii.gov/wastewater/files/2015/09/OSDS_NI.pdf) refers to HAR Title 11, Chapter 62, “which estimates an effluent rate of 200 gpd for each bedroom served by the OSDS”. Based on that assumption, you would have roughly 6,000, 12,000, and 18,000 gal/mo of effluent for a 1 BR, 2 BR, and 3 BR home respectively. The average discharge rate might also be getting pulled up by larger cesspools connected to non-residential parcels (Table 2-2 in the 2014 report), though I am not sure what percentage of the total number of cesspools are non-residential.
Thank you so much Chris, I feel a better knowing I am on the right track.
I will follow the links you provided and do some more reading.
I support what you are doing, and the State getting a hand on our groundwaters.
I am working with a group that is trying to come to a reasonable timetable on pushing forward on priority 1 cesspools, it’s mathematically impossible for the big island to complete 72 conversions a month for the next 6 years (2024 would be the start date for these cesspool Bills). As I do my homework this is one of the numbers that threw me for a loop. I appreciate you responding.
I think your last paragraph has a typo on the 6-12-18,000 gallons a day?
You have my email address from when I signed up, do you have a minute to email or follow up offline
Thank you again
Lance