BLOG POSTS ARE PRELIMINARY MATERIALS CIRCULATED TO STIMULATE DISCUSSION AND CRITICAL COMMENT. THE VIEWS EXPRESSED ARE THOSE OF THE INDIVIDUAL AUTHORS. WHILE BLOG POSTS BENEFIT FROM ACTIVE UHERO DISCUSSION, THEY HAVE NOT UNDERGONE FORMAL ACADEMIC PEER REVIEW.
By Daniela Bond-Smith, Steven Bond-Smith and Carl Bonham
The cost of living in Hawaii continues to rise. In March, the Urban Hawaii (Honolulu) Consumer Price Index (CPI) was 7.5% higher than it was one year ago, squeezing household budgets and disproportionately impacting low-income households. Honolulu last saw an elevated inflation rate of 6.0% briefly in mid-2006, but otherwise inflation has not been over 7.5% since 1991. The recent surge stands in stark contrast to the inflation experience of recent years: between 2017 and 2020, Honolulu inflation averaged just 1.9%. If we take 1.9% to be the typical inflation rate for Honolulu, then the additional 5.6% inflation for the year ending in March can be thought of as “excess inflation.”
Inflation creates budget pressures for households if it is not offset by proportionate increases in income. Inflation varies dramatically across different goods and services (e.g. food versus gasoline). And, the proportion of household income devoted to different goods can vary widely across income levels. The result is that the cost of inflation can also vary widely across income groups. We estimate the differential impact of excess inflation on Honolulu households by analyzing the rise in the cost of household expenditures by income quintile. Each income quintile estimates the income earned by 1/5th of households ordered from lowest earning households in the first quintile to the top 1/5th of the income distribution.
To estimate expenditures by income quintile, we use responses to the US Bureau of Labor Statistics Consumer Expenditure Surveys (BLS-CE) from 2019 and 2020, weighted to be representative of the Hawaii population. Income quintiles are defined using income data for 2019 and 2020 from the US Census Bureau’s American Community Survey. CPI data was obtained from the US Bureau of Labor Statistics. While we do not have measures of consumer prices for the state as a whole, it is common to use the Honolulu CPI as a proxy for the prices consumers face across other islands as well. Assuming unchanged household expenditure baskets relative to 2019/20, in March 2021 dollars, the average household spent $61,530 per year (See Figure 1). The largest share of the average household budget went to housing and household utilities, 38% of expenditure or just over $23,000. Transportation was the third largest budget group, with a 15% share of average household spending. This includes the cost of gasoline which has seen a dramatic 39% increase over the past year, as well as new and used vehicles (up 14.1% combined), and private transportation (up 20%). Combined transportation costs rose by 18% on average. Despite the dramatic surge in gasoline prices, it represents just 3% of the typical household’s budget.
Figure 1: Average shares of expenditure for Honolulu households
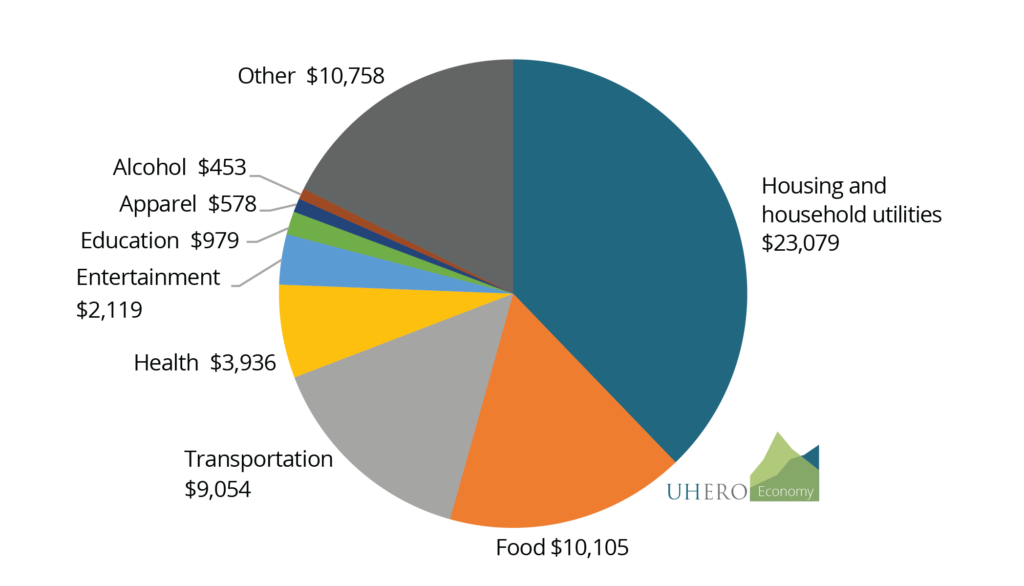
Source: UHERO calculations from responses to the Consumer Expenditure Surveys (BLS-CE).
Expenditure shares vary a lot by income quintile. The lowest income households, in the first quintile, earned less than $38,800 in 2020. These households spent 48% of their total expenditures on housing and household utilities. In contrast, the highest quintile earned more than $163,600 and allocated only 32% of their total spending to housing and household utilities. The second quintile earned between $38,800 and $70,000 per year in 2020, but spent a larger share of their budgets (17%) on transportation than any other quintile. Households in other income quintiles spent between 12.6% and 15.5% of their total spending on transportation.
If households in Honolulu on average purchased the same items in 2022 as they did in 2019 and 2020, then the excess inflation of 5.6% adds an average additional cost of $3,506 per household. The largest component of excess inflation for all income groups is transportation, accounting for between 41% and 48% of the additional cost of living (see Figure 2). While housing and utilities (including household energy costs) make up the largest share of average household expenditure, excess inflation for housing expenses was only 3.3%, or a 20% share of the cost of excess inflation. Increasing food prices contributed the third highest share to the cost of excess inflation, especially for low-income households for whom food makes up one fifth of their budget, now costing an additional $393 per year.
In absolute terms, the total cost of excess inflation ranges from $1,763 for low-income households in the first quintile to $7,206 for high-income households in the fifth quintile. The dollar cost of excess inflation is greater for households in the second quintile ($3,463) compared to the third quintile ($3,334). This is largely due to a significantly greater share of expenditure on transportation.
Figure 2: Cost of excess inflation in Hawaii by quintile and component
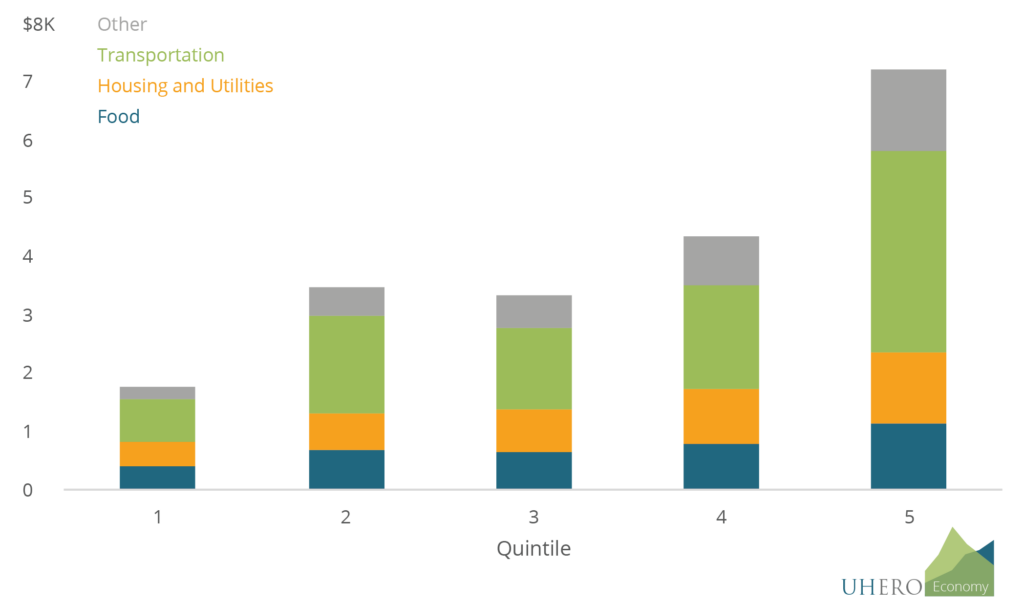
Source: UHERO calculations from responses to the Consumer Expenditure Surveys (BLS-CE) and the American Community Survey.
We can think of the cost of excess inflation as if it were a tax on income by comparing it to annual household income. This additional “income tax” amounts to 8.7% for households in the lowest income quintile while it is substantially lower for households in the highest income quintile at 2.7% (See Figure 3). The surge in inflation over the past year is having a marked impact on Hawai’i households, and these costs are disproportionately borne by lower income households.
Figure 3: Excess inflation as a share of average 2020 income by quintile
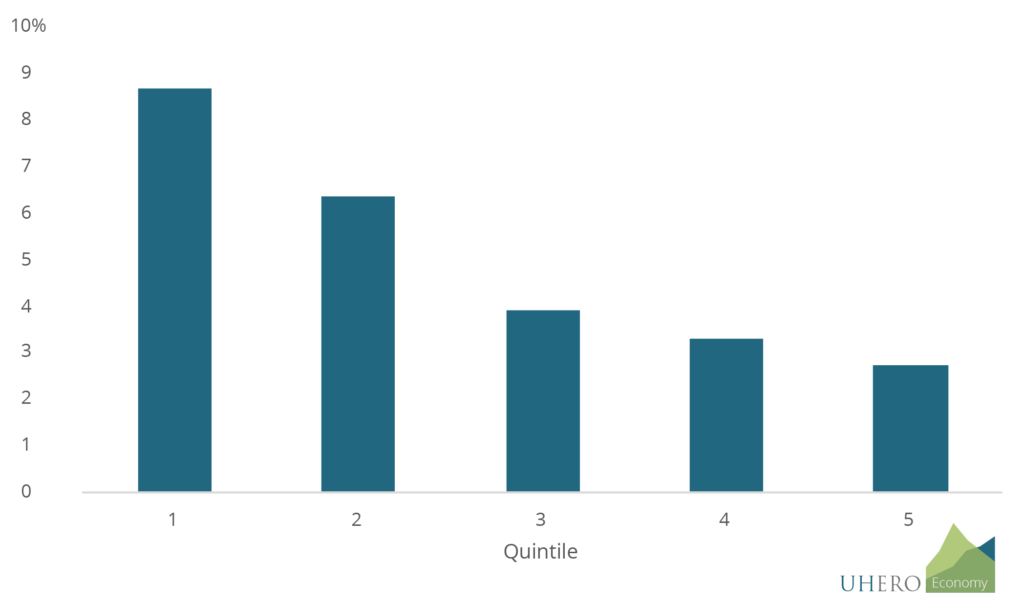
Source: UHERO calculations from responses to the Consumer Expenditure Surveys (BLS-CE) and the American Community Survey.