
UHERO Reports
The Economic Contribution of Waikīkī (2026 Update)
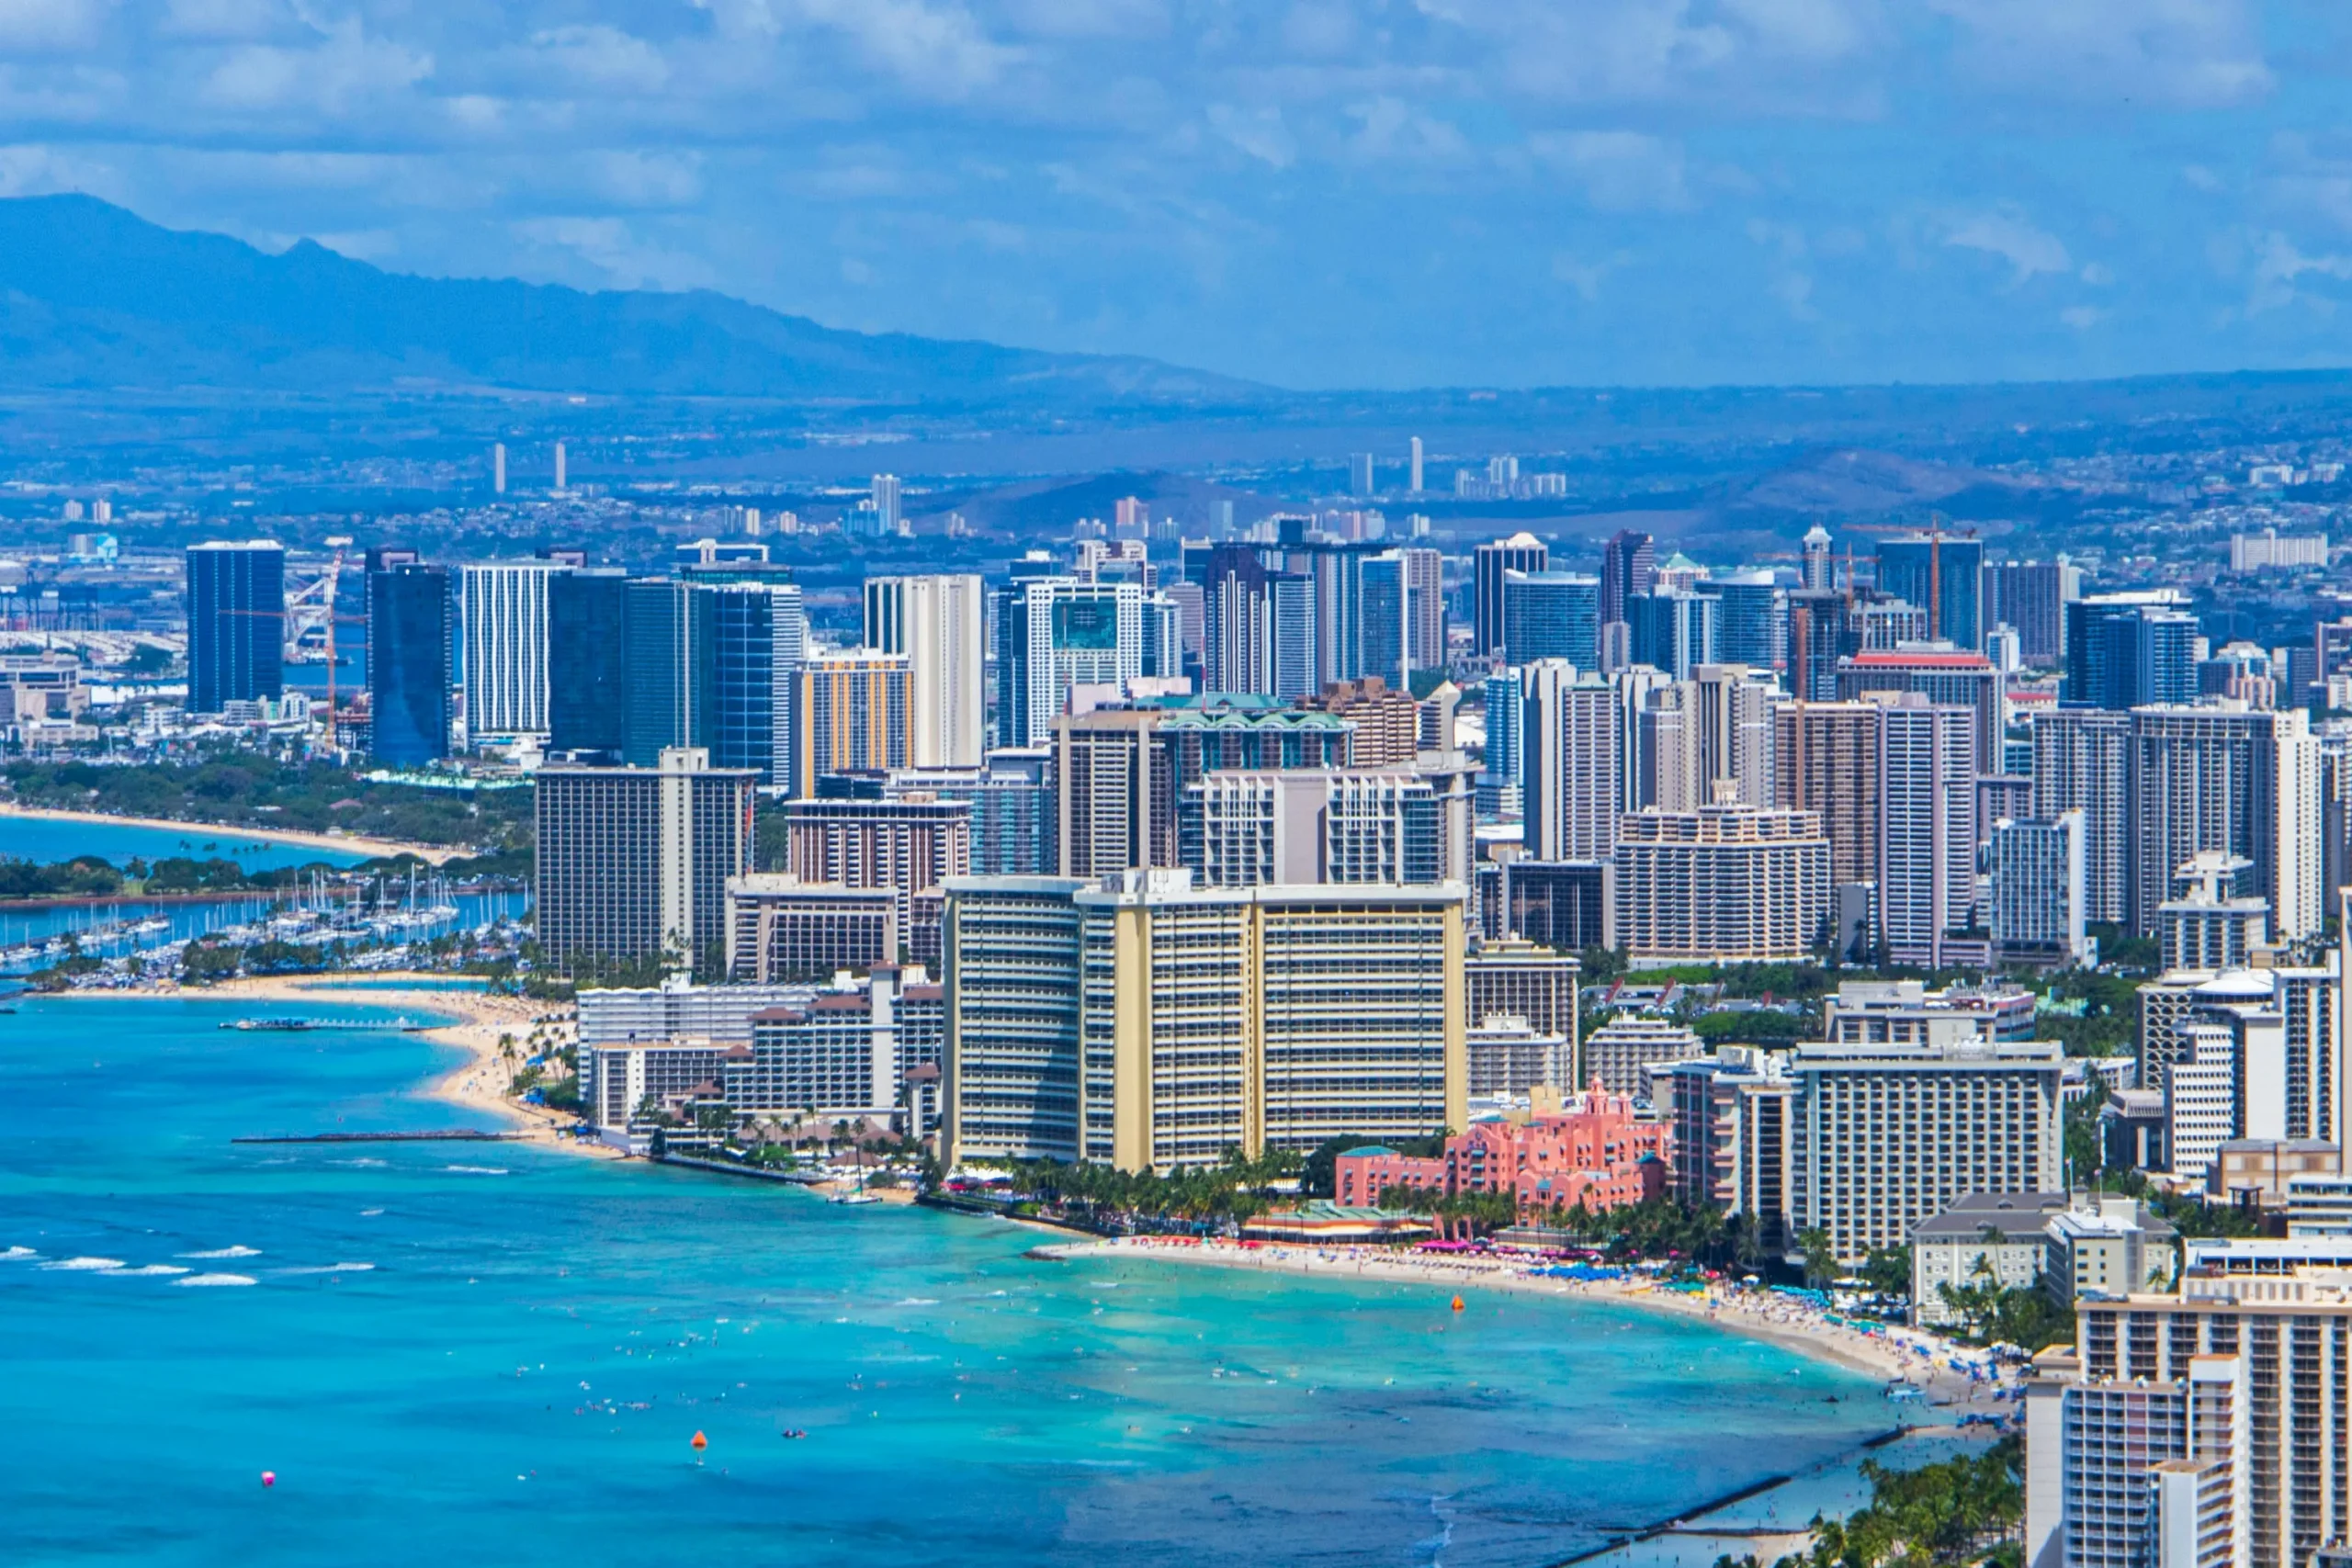
Waikīkī, through tourism-related activity, accounted for an estimated $6.9 billion, or 6% of Hawai‘i’s Gross State Product in 2024. In addition, Waikīkī’s attraction of visitors can be credited with 62,000 civilian jobs statewide (7% of the total) and $799 million in state tax revenues (7% of the total). A sign of Waikīkī’s outsized contribution to the state economy, the area’s population is 20,470 as of April 1, 2020, representing just 2.0% of O‘ahu’s resident population. The trend of visitors diversifying their allocation of visitor days from O‘ahu to the Neighbor Islands continues, but Waikīkī remains the flagship with 38% of all visitor units (inventory and occupancy). Some $8.7 billion, or 36% of all visitor expenditures in the state were generated by Waikīkī-based visitor activity during 2024. Using the same metrics as the State of Hawaii Department of Business Economic Development and Tourism (DBEDT) (2003) brief, the contribution to the state economy by tourism is $18.9 billion of the $115 billion total Gross State Product (GSP) for 2024. That is, about 16% of Hawai‘i’s GSP for the year was generated by visitor activity and is the largest single contributor to Hawai‘i’s annual GSP.
The findings and recommendations are those of the author(s) and do not reflect the views or official positions of UHERO, the University of Hawai’i, or any funding or supporting organization.
This paper is funded by the Waikīkī Beach Special Improvement District Association and coordinated by the University of Hawai‘i Sea Grant College Program, SOEST, under Institutional Grant No. NA24OARX417C0024 from NOAA Office of Sea Grant, Department of Commerce. The views expressed herein are those of the author(s) and do not necessarily reflect the views of NOAA or any of its subagencies.
Hawai‘i Sea Grant Report Number: UNIHI-SEAGRANT-5034.
View Full Report
Executive Summary
Waikīkī, through tourism-related activity, accounted for an estimated $6.9 billion, or 6% of Hawai‘i’s Gross State Product in 2024. In addition, Waikīkī’s attraction of visitors can be credited with 62,000 civilian jobs statewide (7% of the total) and $799 million in state tax revenues (7% of the total). A sign of Waikīkī’s outsized contribution to the state economy, the area’s population is 20,470 as of April 1, 2020, representing just 2.0% of O‘ahu’s resident population. The trend of visitors diversifying their allocation of visitor days from O‘ahu to the Neighbor Islands continues, but Waikīkī remains the flagship with 38% of all visitor units (inventory and occupancy). Some $8.7 billion, or 36% of all visitor expenditures in the state were generated by Waikīkī-based visitor activity during 2024. Using the same metrics as the State of Hawaii Department of Business Economic Development and Tourism (DBEDT) (2003) brief, the contribution to the state economy by tourism is $18.9 billion of the $115 billion total Gross State Product (GSP) for 2024. That is, about 16% of Hawai‘i’s GSP for the year was generated by visitor activity and is the largest single contributor to Hawai‘i’s annual GSP.
In 2002, Waikīkī tourism accounted for 8% of Hawai‘i’s Gross State Product, or $3.6 billion, in addition to 10% of all civilian jobs statewide and 12% of all state tax revenues. Likewise, the population was 19,720 on April 1, 2000, or 2.3% of O‘ahu’s resident population at the time. In comparison, in 2002 44% of all visitors in the state were based in Waikīkī on the average day. Waikīkī had 45% of the available visitor units in the state for 2002. More than $5 billion, or 46% of all visitor expenditures in the state were generated by Waikīkī-based visitor activity during 2002. At that time, tourism’s contribution of $8.0 billion compared with a total Gross State Product of $46 billion, meaning 17% of that year’s GSP was generated by visitor activity.
Introduction
Defining Waikīkī
Assessing the economy of Waikīkī presents some challenges. There are different notions of how Waikīkī should be defined geographically and measures of population and housing statistics are not all on the same geographical basis as measures of businesses and employment. Overall, there is enough compatibility to draw some conclusions about the overall role that Waikīkī plays in the state’s economy.
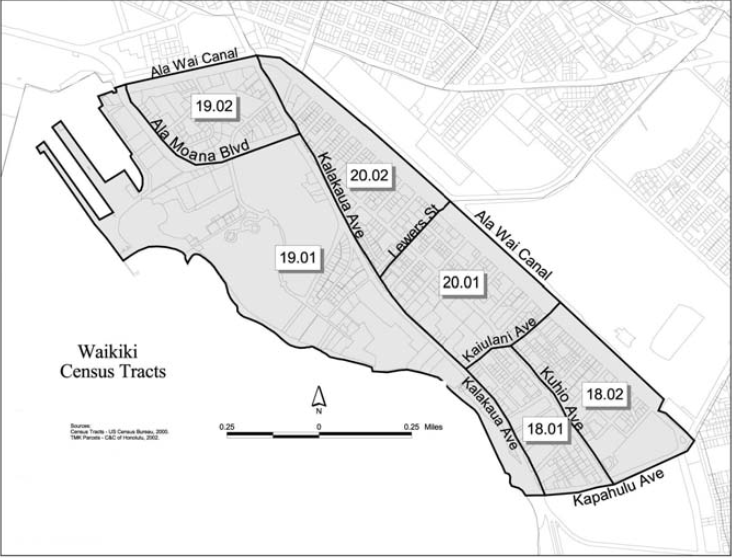
Waikīkī is most often defined as the area bounded on the north and east by the Ala Wai canal from Kapahulu Avenue to the Ocean (including the Ala Wai Boat Harbor), on the south by Kapahulu Avenue and on the west by the ocean shoreline[1]. We define Waikīkī in a fashion identical to the State of Hawaii Department of Business Economic Development and Tourism (DBEDT) (2003) brief as shown in Figures 1 and 2.
According to the 2020 Census of population the resident population of the Waikīkī area, as defined for this report, (see footnote 1) was 20,470 on April 1, 2020. This represented about 2.0% of O‘ahu’s resident population and amounted to 750 more residents than recorded for the area in 2000 (U.S. Census Bureau, 2020). If we use the entirety of ZIP Code 96815 (including the Kapahulu residential area), the resident population jumps to 28,786 for April 1, 2020 (U.S. Census Bureau, 2020). Even with this addition, the area’s population is still only about 2.8% of the O‘ahu total, further highlighting Waikīkī‘s outsized economic contribution.
Figure 1. Study area with 2020 Census Tracts numbered 18.01 through 20.06 in 2025 (State of Hawaii Office of Planning, 2022)
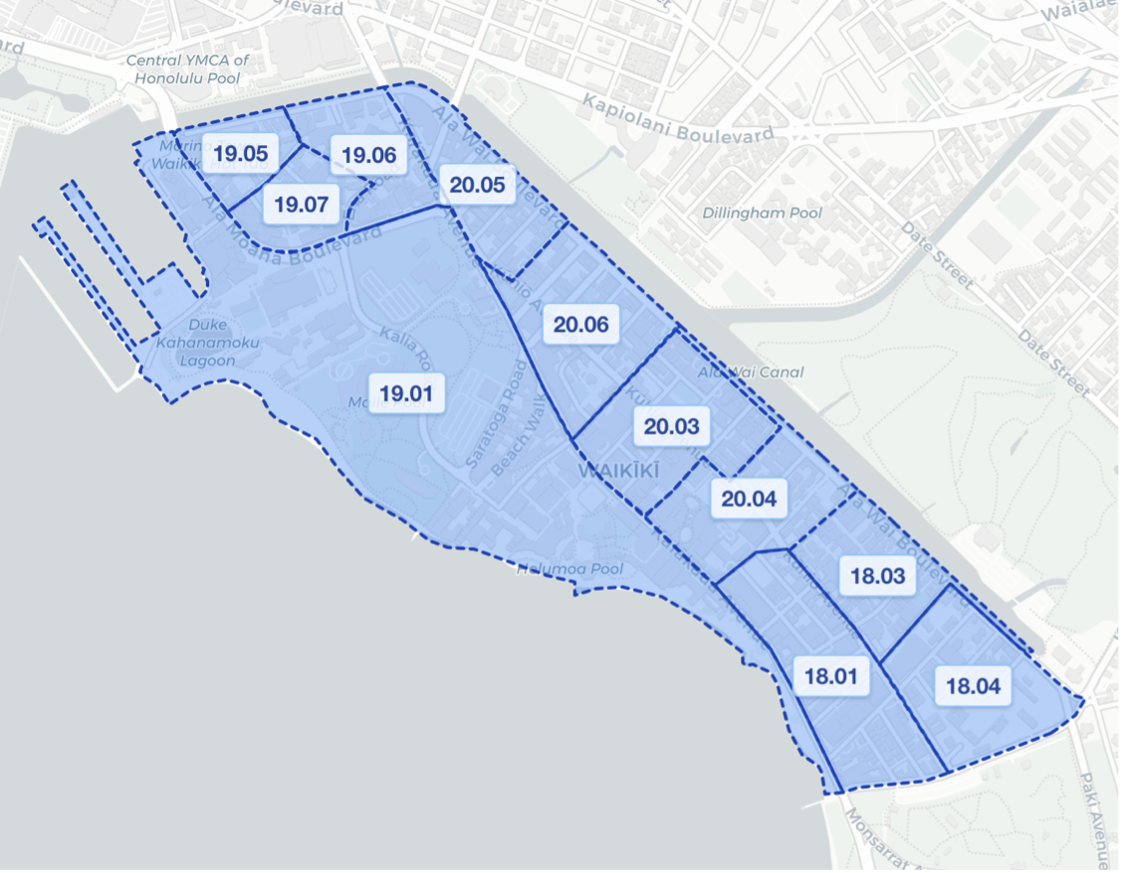
Figure 2. Study area with 2000 Census Tracts numbered 18.01 through 20.02 in 2003 (State of Hawaii Department of Business Economic Development and Tourism (DBEDT), 2003)
The Economy of Waikīkī
Waikīkī’s significance increases substantially when the focus is on its role in the tourism economy. As we will see below, Waikīkī remains the anchor for the State’s visitor industry, which is in turn the major driving force in Hawai‘i’s economy. Making use of standard economic and industry metrics, we identify the Gross State Product (GSP), visitor arrivals, visitor spending, hotel occupancy, Average Daily Rate (ADR), Revenue per Available Room (RevPAR), and report dollar amounts in either nominal dollars (current year) or deflated to 2002 dollars such that results are directly comparable to the original State of Hawaii Department of Business Economic Development and Tourism (DBEDT) (2003) brief.
Visitor Industry
Over the past several decades the state’s visitor industry has continued to diversify geographically from O‘ahu to the Neighbor Islands, particularly Maui. This has increased the variety of the tourism product that the state is able to provide visitors and has enabled the Neighbor Islands to share in the economic growth generated by visitor activity. On the other hand, it has also reduced Waikīkī’s share of statewide tourism over time (though Waikīkī’s absolute visitor numbers continue to grow) (Figure 8).
Nevertheless, Waikīkī remains the state’s flagship destination in terms of sheer size. An average of about 87,889 visitors per day occupied Waikīkī’s visitor units in 2024 (Table 3). This represents 38.4% of the statewide average daily visitor census for that year.
Waikīkī and O‘ahu attract disproportionately more international visitors than the state as a whole. About 25% of O‘ahu’s visitors in 2024 were international travelers. This compares with just 16% for the state as a whole. The international market has grown over the past decades, but contracted dramatically in 2020 in the face of government-imposed restrictions on travel and more recently a strong US dollar.
As Table 1 shows, Waikīkī accounted for 38% of the state’s visitor-unit inventory for 2025. This amounted to more than 32,200 visitor units (State of Hawaii Department of Business Economic Development and Tourism (DBEDT), 2025b).
Table 1. Inventory of Visitor Units, 2025
| Type | Waikīkī | O‘ahu | Statewide | ||
| Number | Number | % in Waikīkī | Number | % in Waikīkī | |
| All Units | 32,209 | 41,092 | 78.4% | 85,227 | 37.8% |
| Apartment/hotel | 0 | 2 | 0.0% | 18 | 0.0% |
| Bed & Breakfast | 3 | 56 | 5.4% | 456 | 0.7% |
| Condominium Hotel | 2,442 | 3,798 | 64.3% | 7,727 | 31.6% |
| Hostel | 460 | 484 | 95.0% | 694 | 66.3% |
| Hotel | 23,369 | 27,797 | 84.1% | 44,785 | 52.2% |
| Indiv. Vacation Unit | 3,358 | 4,722 | 71.1% | 18,211 | 18.4% |
| Other | 0 | 225 | 0.0% | 420 | 0.0% |
| Number & percent of above units classified as Registered Timeshare | 2,577 | 4,008 | 64.3% | 12,916 | 20.0% |
Waikīkī’s strong suit is the full-service hotel market, with the area accounting for 52% of such units statewide. These properties tend to have higher staffing levels and revenues than other types of visitor units. On the other hand, Waikīkī accounted for only 32% of the condominium units in visitor use statewide (State of Hawaii Department of Business Economic Development and Tourism (DBEDT), 2025b).
Waikīkī has a modest presence in the growing timeshare market. Timeshare units accounted for just over 15% of the state’s visitor-unit inventory in 2025. Only 8% of the units in Waikīkī were timeshare, and Waikīkī accounted for 20% of timeshare units statewide (State of Hawaii Department of Business Economic Development and Tourism (DBEDT), 2025b).
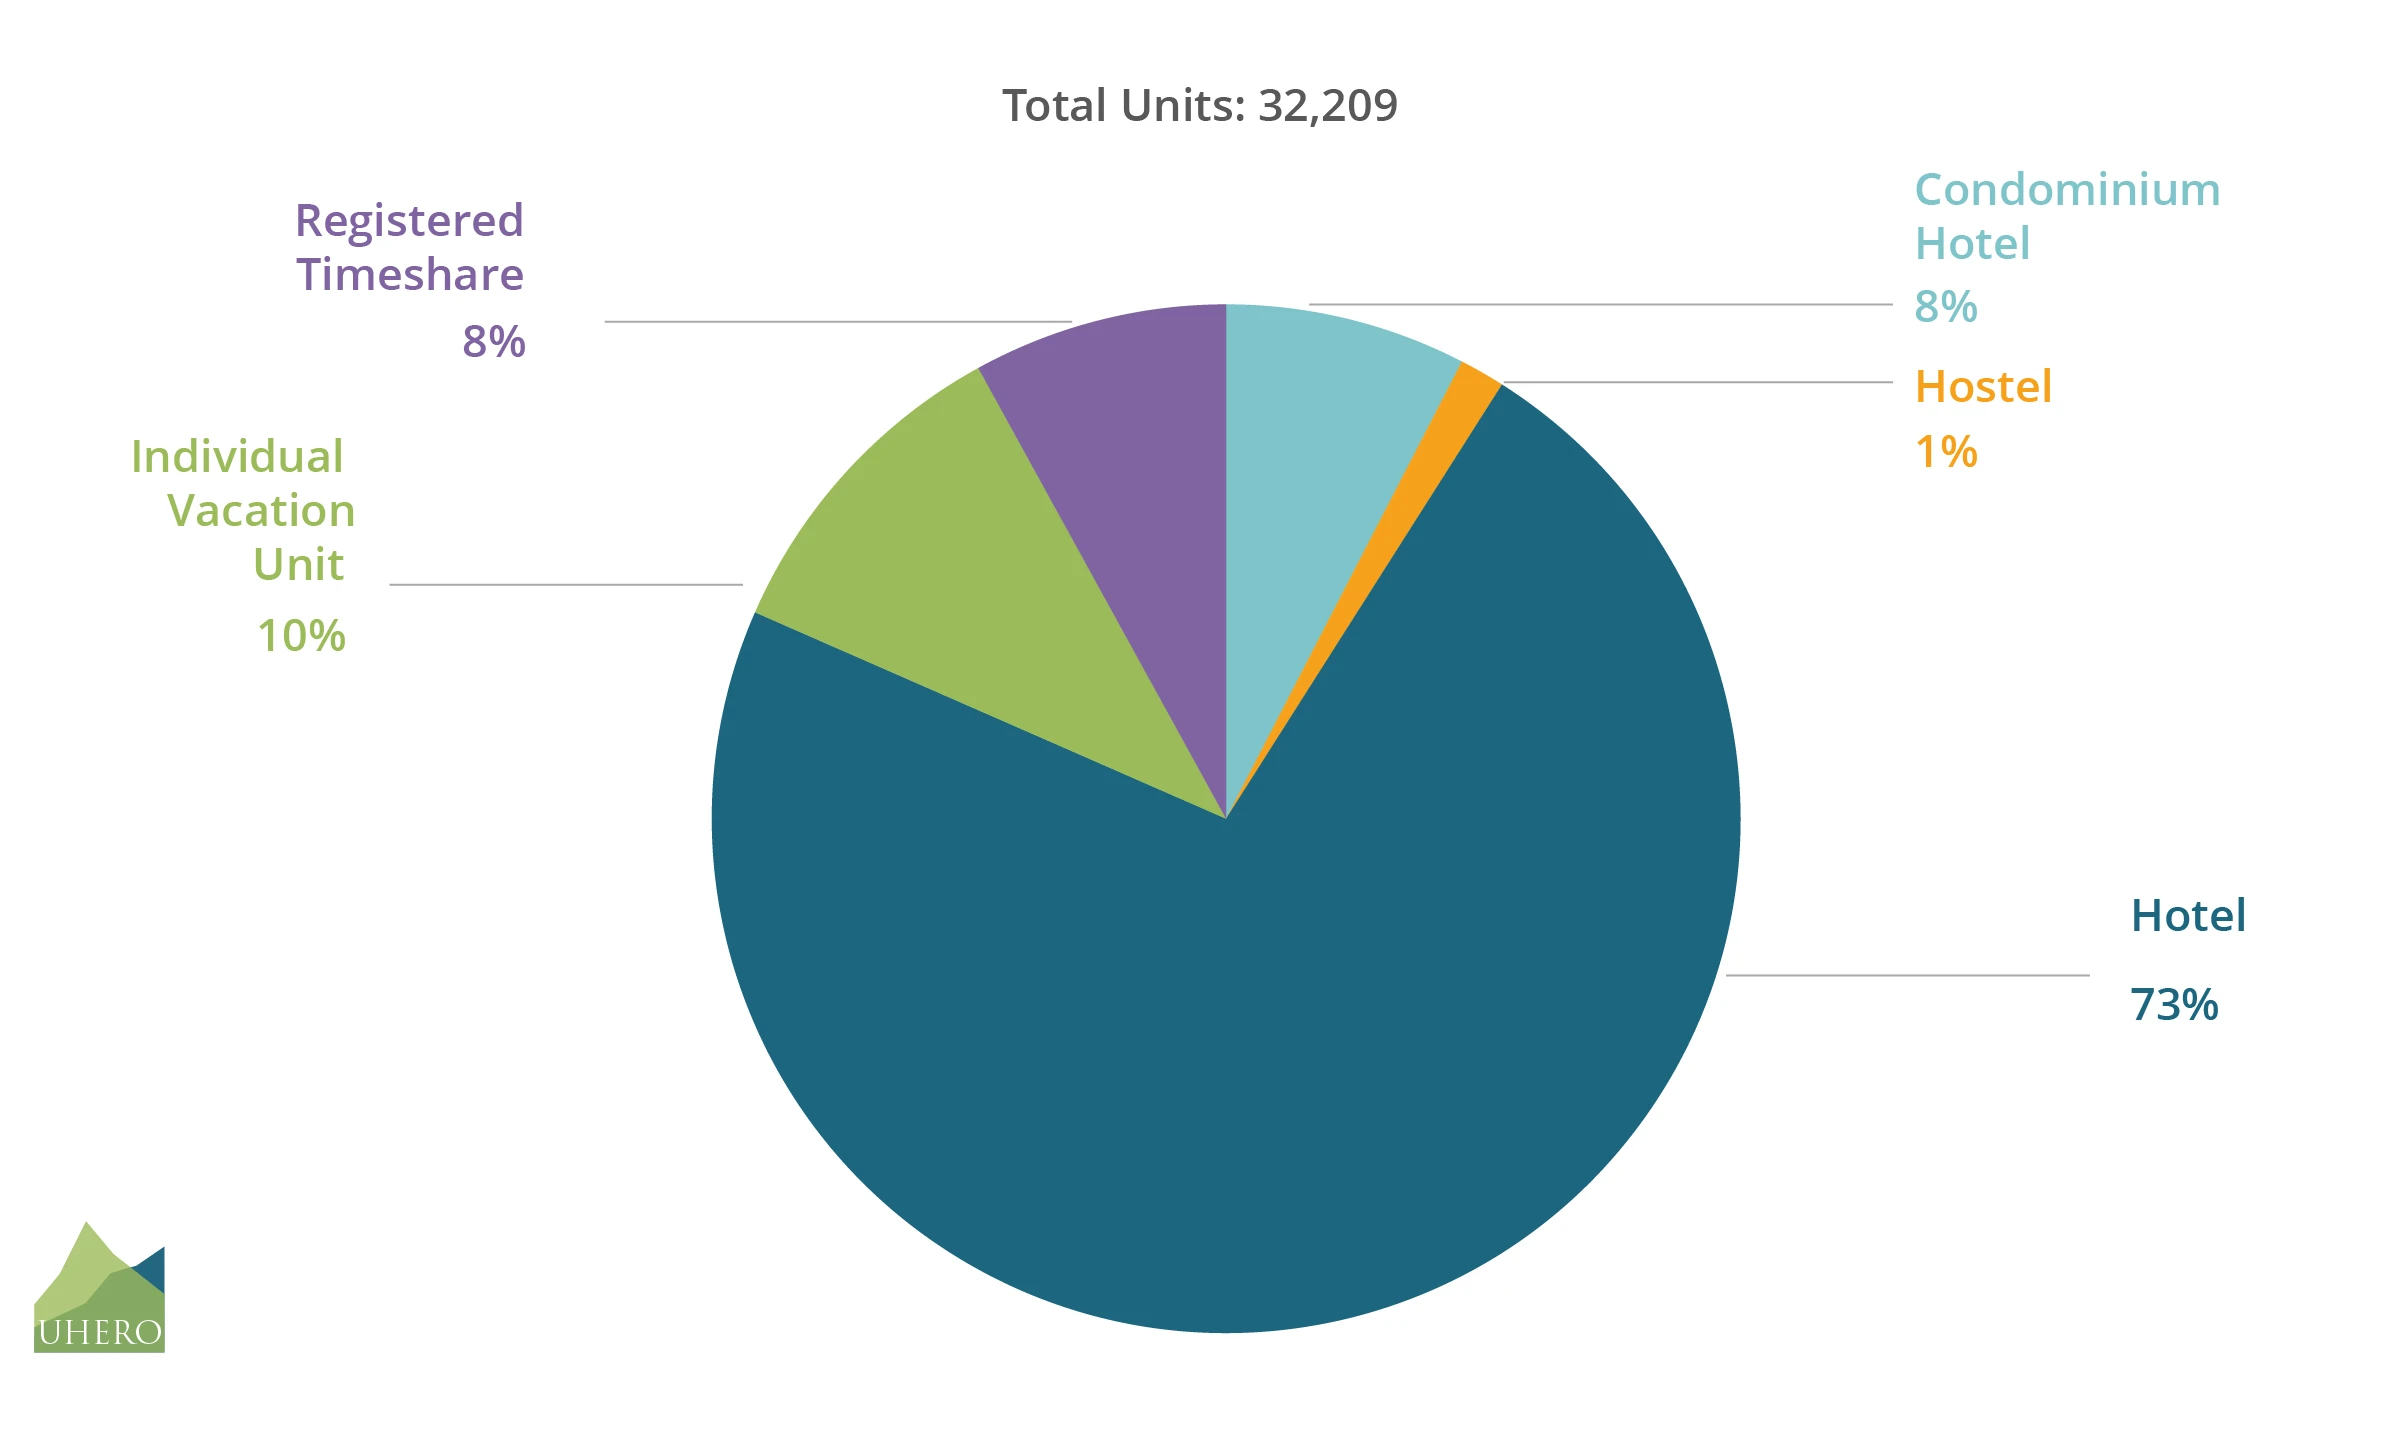
As Figure 3 shows, full-service hotels dominate the visitor-unit inventory in Waikīkī with 73% of all units (percent share not shown in Table 1). The combination of hotels and condominium units in visitor use account for 80% of all units in Waikīkī.
Figure 3. Waikīkī Visitor Units, 2025 (State of Hawaii Department of Business Economic Development and Tourism (DBEDT), 2025b) as a share of all available units in Waikīkī.
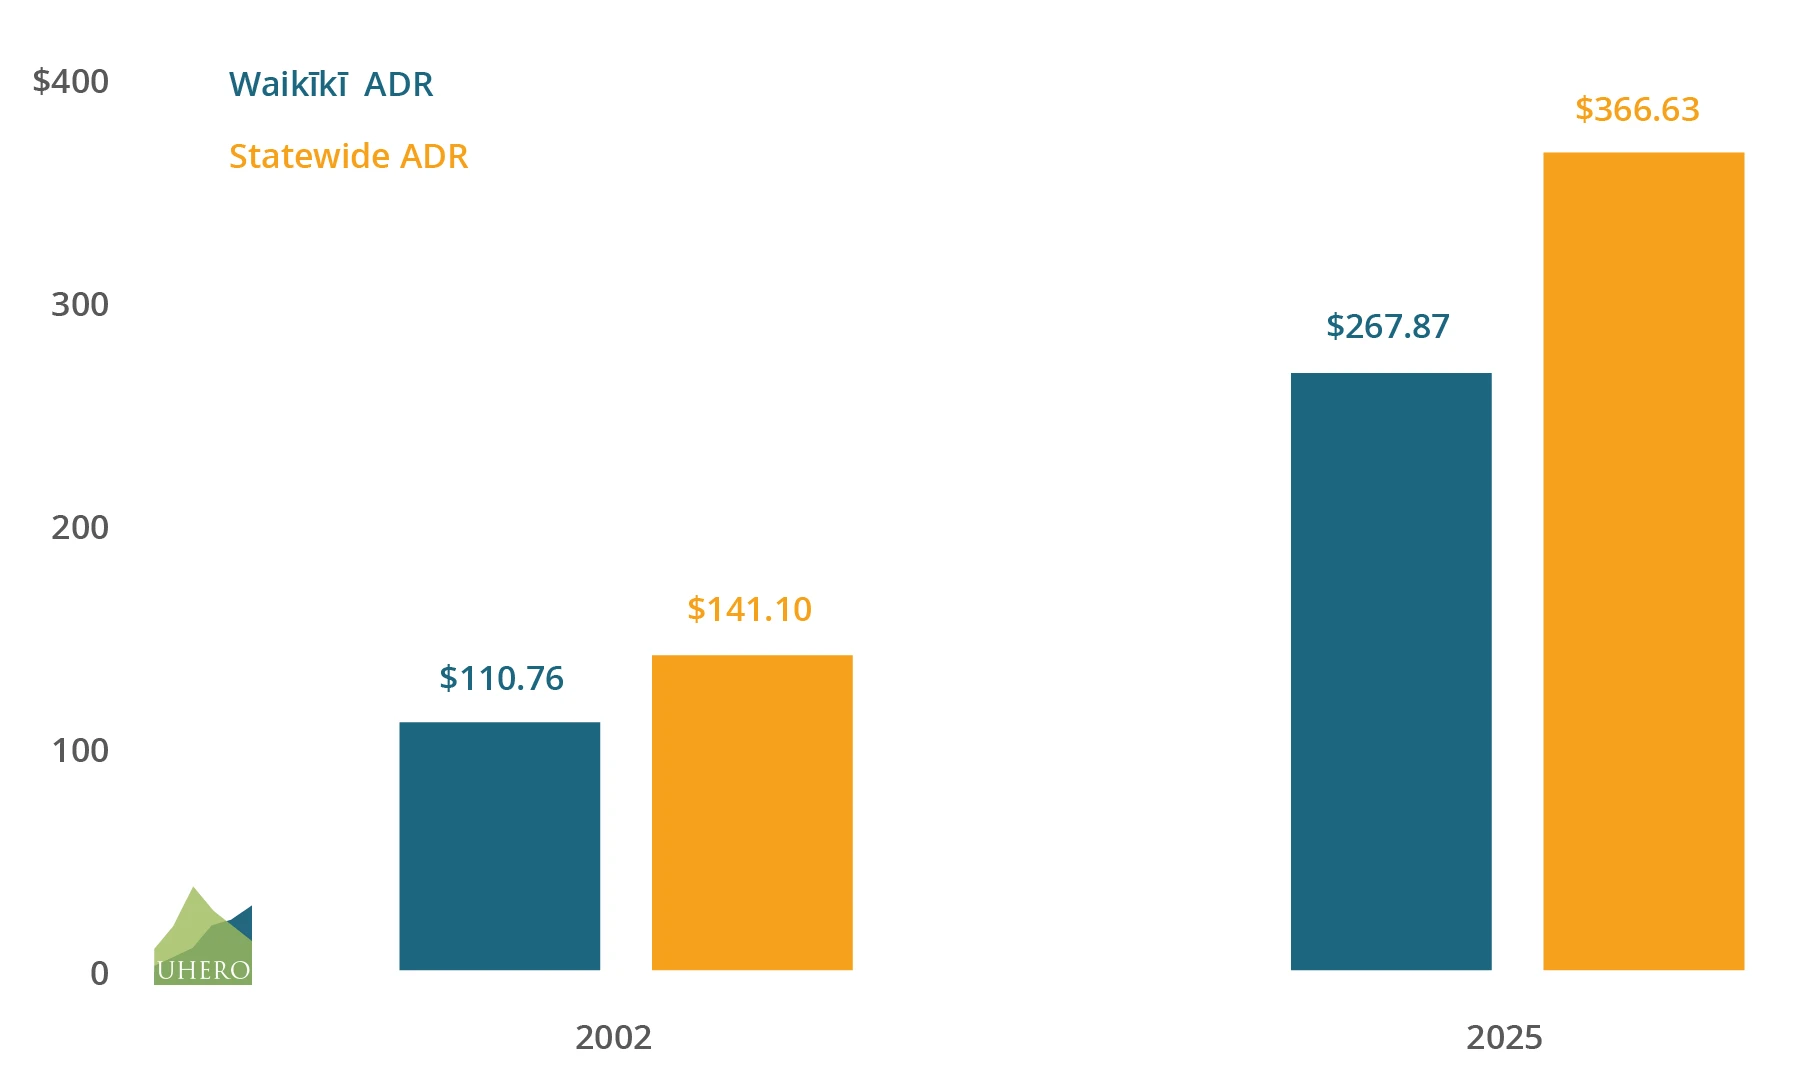
According to industry analytics provider STR (originally Smith Travel Research) (State of Hawaii Department of Business Economic Development and Tourism (DBEDT), 2026), the occupancy rate for Waikīkī hotels in 2025 was 79.4%, about six percentage points above the state average but one percentage point lower than the 2024 level for Waikīkī. The average daily hotel room rate in Waikīkī was below the state average in 2025, with Waikīkī’s average hotel rate at $268 for the year compared with a state average of $367. The average Waikīkī rate for 2025 was down $3 per room from 2024, compared to a $2 increase statewide. The occupancy rate for Waikīkī hotels in 2002 was 70.3%, with an average daily rate of $111 (State of Hawaii Department of Business Economic Development and Tourism (DBEDT), 2003). As Figure 4 indicates, Waikīkī room rates have increased dramatically, though more slowly than the state average over the past twenty-three years.
Figure 4. Average Hotel Room Rates, in nominal terms (State of Hawaii Department of Business Economic Development and Tourism (DBEDT), 2003, 2026)
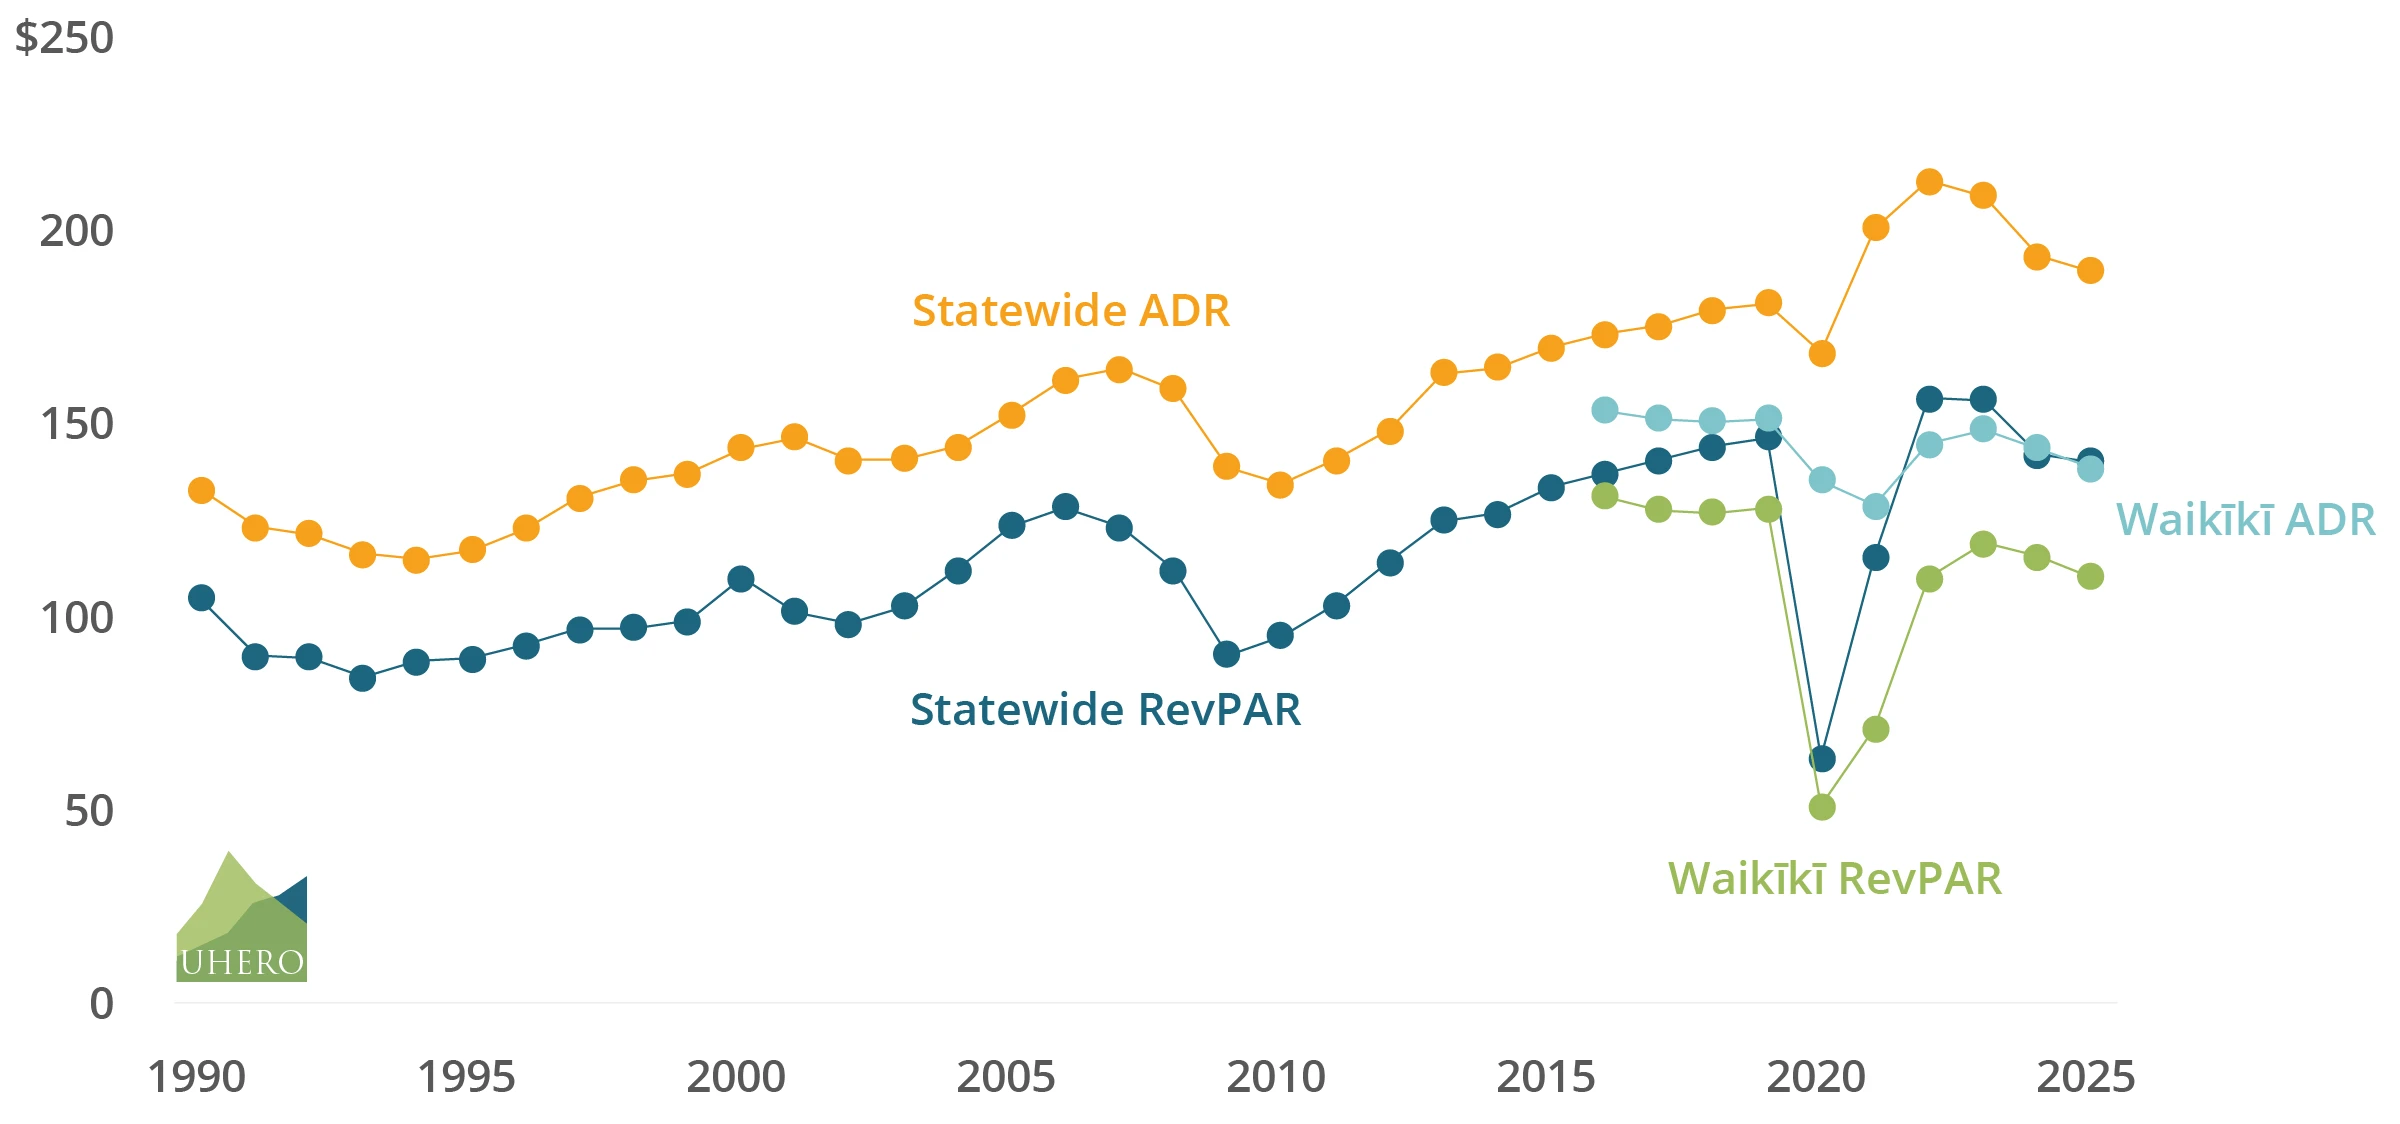
Historically, room rates for both Waikīkī and accommodations statewide have generally increased over time with some interruptions (Table A1, Table A2), in both Average Daily Rate (ADR) and Revenue per Available Room (RevPAR). In nominal terms, the increase is dramatic, with statewide ADR and RevPAR more than tripling since 1990 (Figure 5). The results are much more modest when adjusted for inflation, with all results (Waikīkī, statewide, ADR, and RevPAR) seeing a modest decrease after 2023 (Figure 6).
Figure 5. Room rates, 1990 – 2025, in nominal terms (State of Hawaii Department of Business Economic Development and Tourism (DBEDT), 2025a)
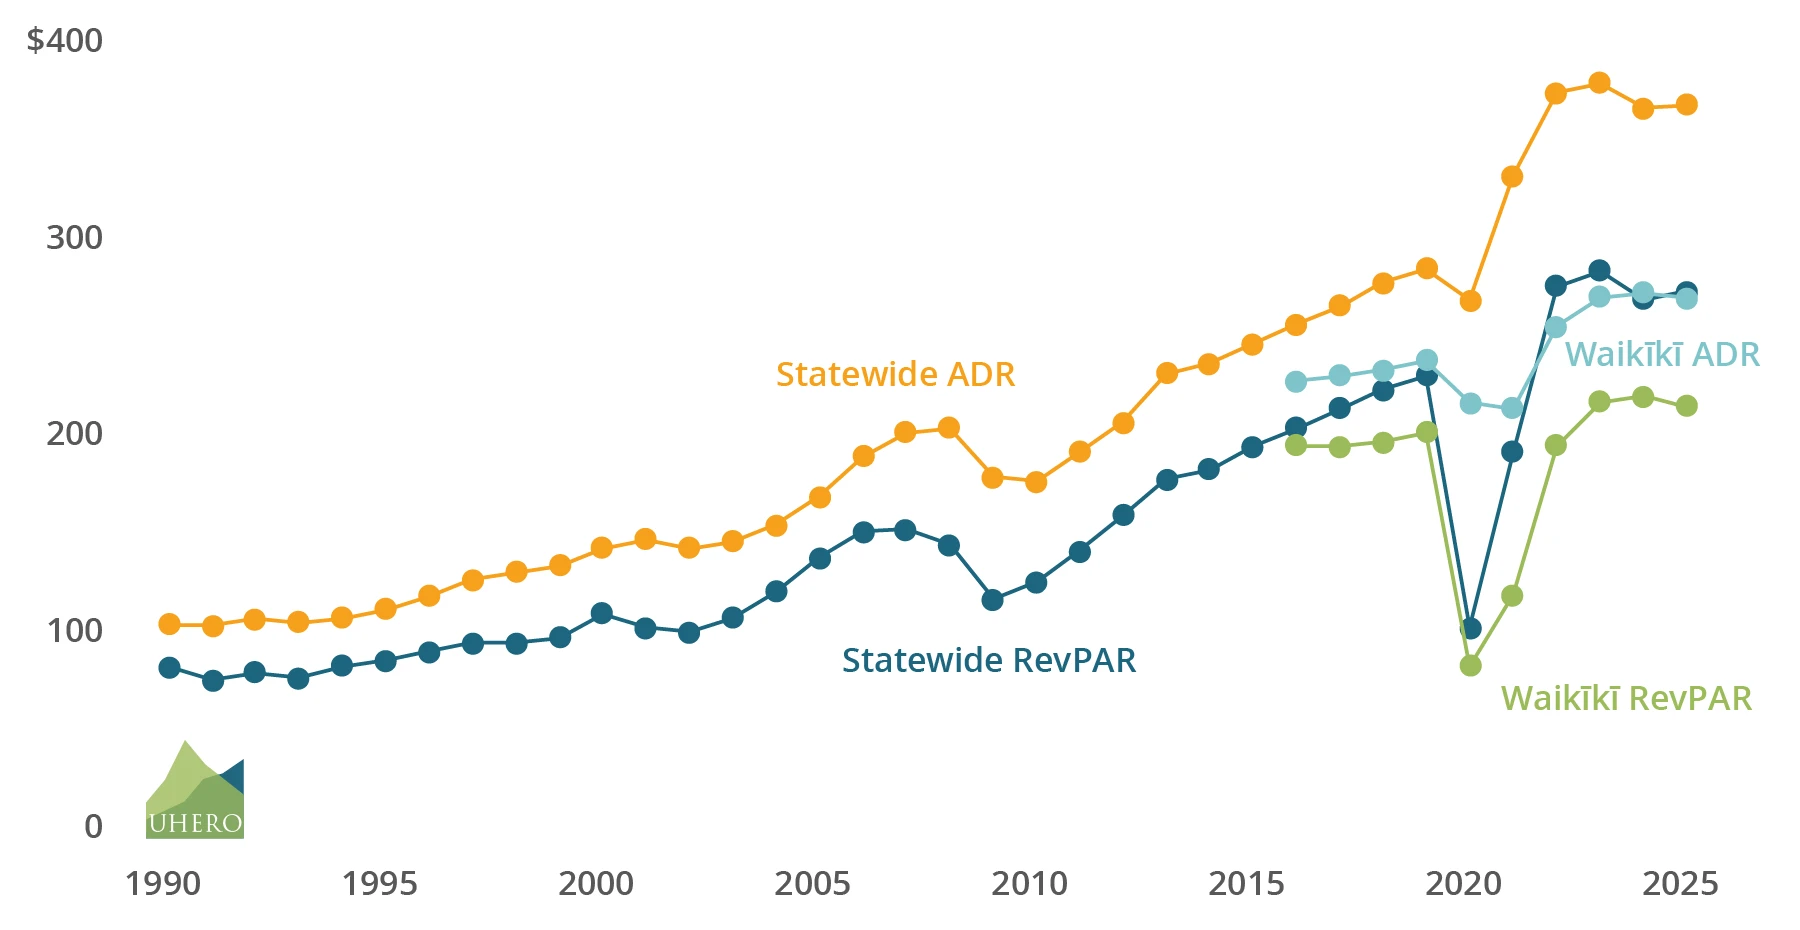
Figure 6. Room rates, 1990 – 2025, adjusted for inflation (shown in 2002 dollars) (State of Hawaii Department of Business Economic Development and Tourism (DBEDT), 2025a)
Employment & Businesses
Not surprisingly, Waikīkī is a major employment center for the Island of O‘ahu. Based on business and employment information compiled by ZIP Code by the Bureau of the Census, the Waikīkī area (ZIP Code 96815) contained 1,488 businesses in the year 2023[2]. These businesses employed about 26,027 workers and paid total wages of $1.3 billion for the year (U.S. Census Bureau, 2023).
Waikīkī has a relatively small resident population but is home to a disproportionately large number of jobs. In 2024 the area supplied more than 52,900 jobs statewide from visitor activity (State of Hawaii Department of Business Economic Development and Tourism (DBEDT), 2025a), while census data show that fewer than 16,000 wage and salary workers actually lived in the area in 2024 (U.S. Census Bureau, 2024). It is abundantly clear that Waikīkī serves as a major employment center for the Island as a whole.
Retail trade, accommodations & food service industries accounted for about 49% of the 1,488 business establishments in the Waikīkī ZIP Code area (U.S. Census Bureau, 2023). The distribution of firms among the various industries is shown in Table 2. It should be noted that these categories sum to 1,486 establishments, but the official published number is 1,488. Table 2 was reproduced from source without alteration. The employment in these individual industries is not available.
Table 2. Establishments in Waikīkī, 2023 (U.S. Census Bureau, 2023)
| Industry | Number of establishments | Industry | Number of establishments |
| All establishments | 1,488 | Professional, scientific, and technical services | 92 |
| Construction | 28 | Management of companies and enterprises | 19 |
| Manufacturing | 7 | Administrative and support and waste management and remediation services | 87 |
| Wholesale trade | 37 | Educational services | 17 |
| Retail trade | 378 | Health care and social assistance | 42 |
| Transportation and warehousing | 35 | Arts, entertainment, and recreation | 20 |
| Information | 18 | Accommodation and food services | 352 |
| Finance and insurance | 29 | Other services (except public administration) | 199 |
| Real estate and rental and leasing | 122 | Industries not classified | 4 |
Economic Contribution of Waikīkī
Waikīkī is the largest among a handful of unique geographical areas of the state that generate substantial export (tourism) income for Hawai‘i. Most geographical areas of the state have some sort of business activity that adds to employment, income, taxes and Gross State Product (GSP). However, in most cases, a good deal of this business represents secondary spending of export-industry income earned elsewhere in the state.
Waikīkī, on the other hand, is a major platform for the export of the state’s visitor services. In this role it facilitates the injection of billions of outside dollars into the rest of the economy. For this reason, Waikīkī is not only a source of employment, income and taxes, but also one of the state’s major economic growth assets. Its effectiveness in competing for visitors and providing them a satisfying vacation experience is important to the stability and growth of the state’s economy. Much like the anchor store in a shopping center, Waikīkī’s visitors will spread their vacation spending around to other businesses on the island. Many visitors will also book neighbor island visits for a day, overnight or longer.
But how much does Waikīkī matter in the economy? It is difficult to know precisely how much Waikīkī tourism contributes to the economy, but a rough estimation is possible based on the area’s share of state tourism.
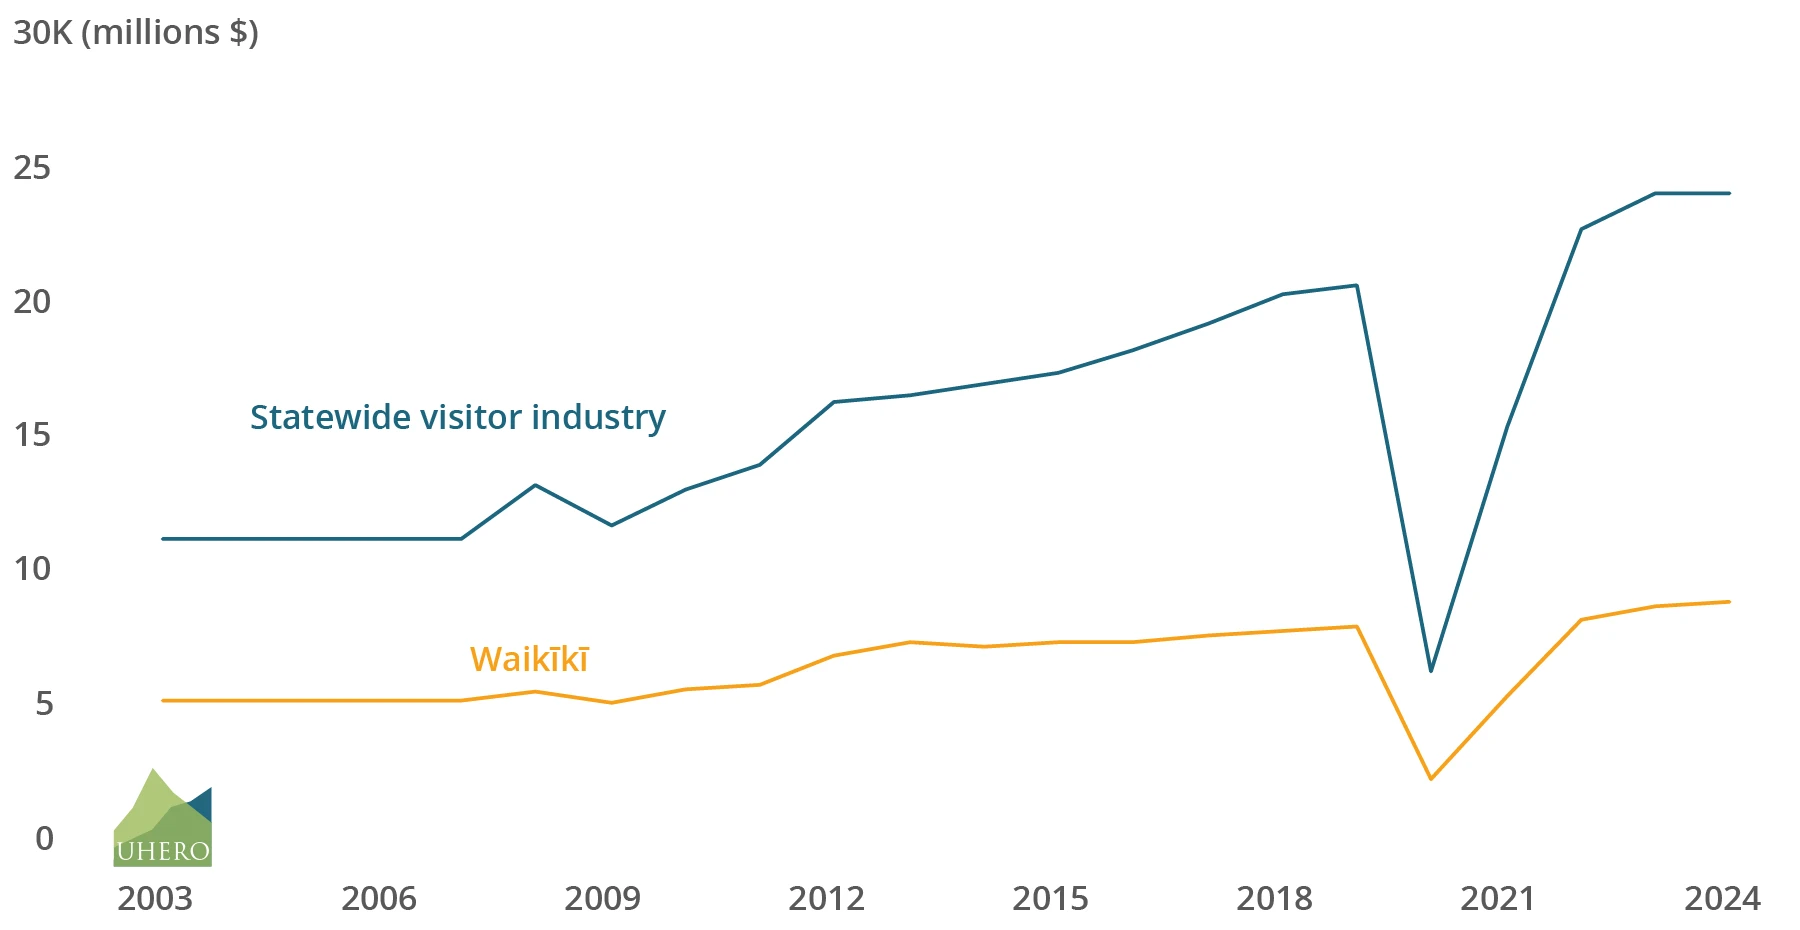
The estimated role of Waikīkī in Hawai‘i’s statewide tourism industry is shown in Table 3. Depending on the measure, Waikīkī accounted for between 36% and 42% of statewide tourism in 2024 (we use 36% for a conservative estimate). About 38% of all visitors in the state were based in Waikīkī on the average day in 2024. Waikīkī also had 38% of the available visitor units in the state that year. Some $8.7 billion, or 36% of all visitor expenditures in the state were generated by Waikīkī-based visitor activity during 2024. In comparison in 2002, 44% of all visitors in the state were based in Waikīkī on the average day. Waikīkī had 45% of the available visitor units in the state for 2002. More than $5 billion, or 46% of all visitor expenditures in the state were generated by Waikīkī-based visitor activity during 2002.
Table 3. Waikīkī’s Share of Tourism: 2024
| Waikīkī | |||
| Measure of tourism | Statewide visitor industry | Number | Percent of statewide tourism |
| Visitor arrivals by air (see also Figure 7) | 9,533,375 | 5,794,854A | N/AB |
| Average daily visitor census | 228,752 | 87,889 | 38.4% |
| Visitor units | 83,058 | 31,473 | 37.9% |
| Occupied visitor units | 60,882 | 25,304 | 41.6% |
| Total visitor expenditures ($ millions)C | 23,910 | 8,699 | 36.4% |
B Percent is not applicable because many visitors tour more than one island.
C Includes a portion of the overseas airfare supporting Hawai‘i-based airline services and spending by cruise lines on supplies and maintenance.
Source: Estimates by the Hawai‘i State Department of Business, Economic Development & Tourism.
Figure 7. Visitor arrivals by air, 2003 – 2024 (State of Hawaii Department of Business Economic Development and Tourism (DBEDT), 2025a). DBEDT uses Oahu arrivals for Waikīkī as noted in Table 3.
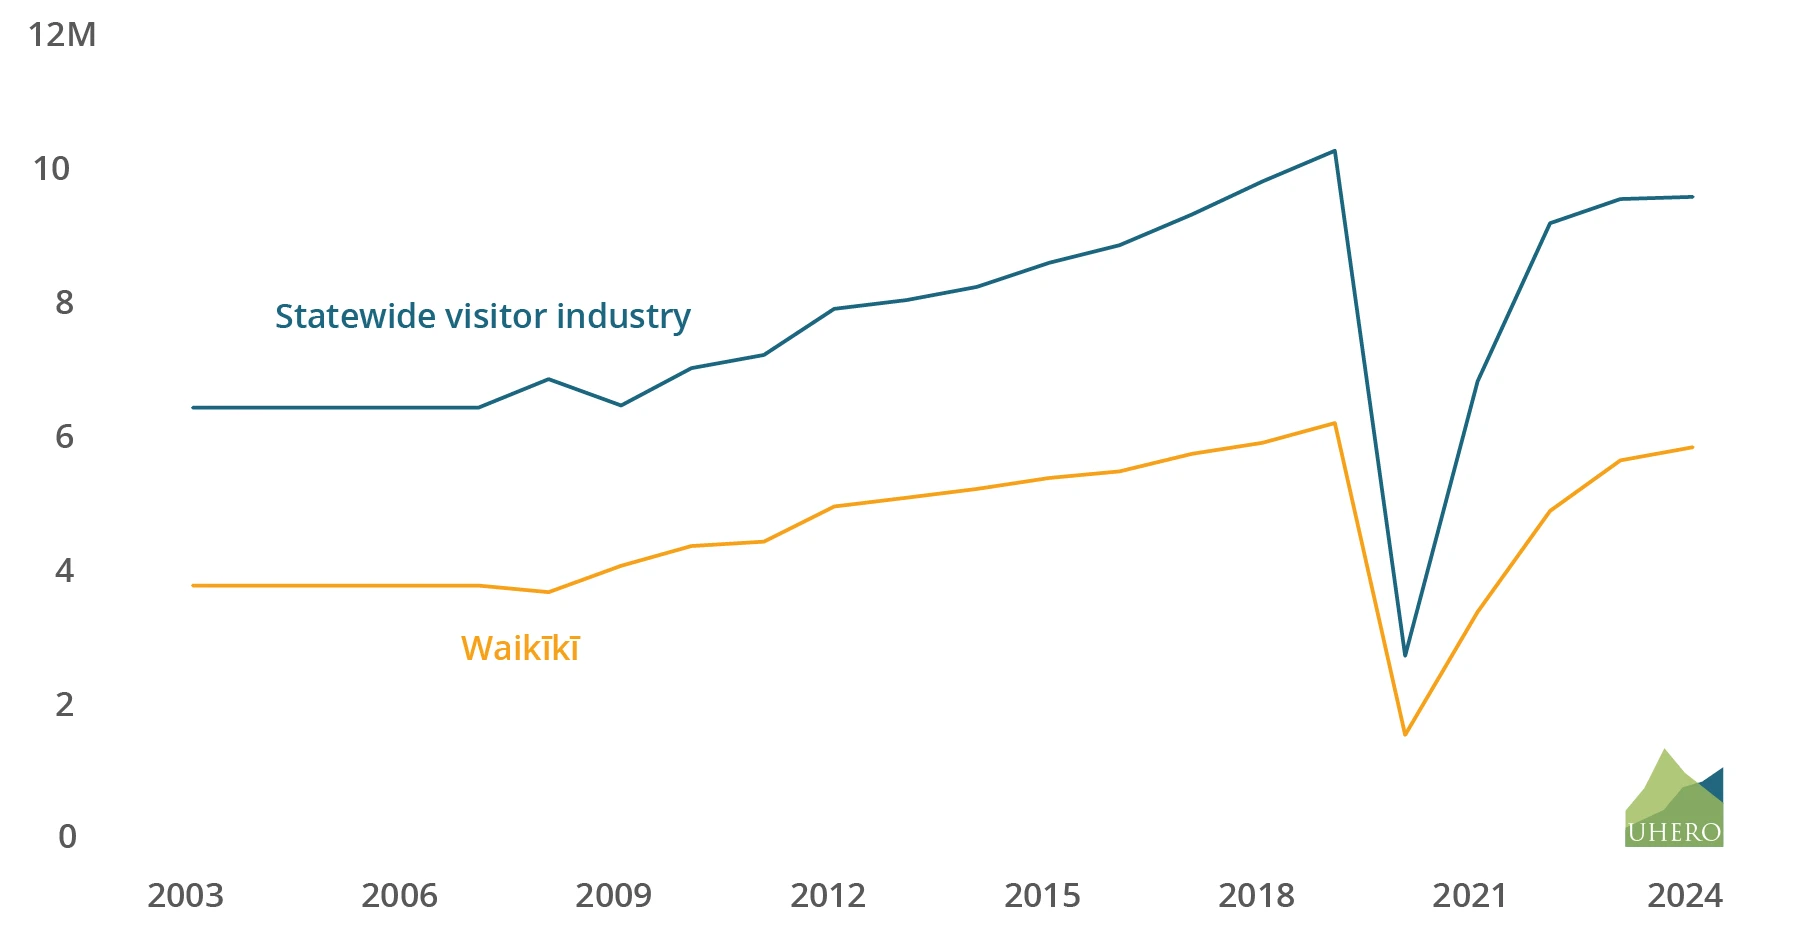
Figure 8. Average daily visitor census, 2003 – 2024 (State of Hawaii Department of Business Economic Development and Tourism (DBEDT), 2025a)
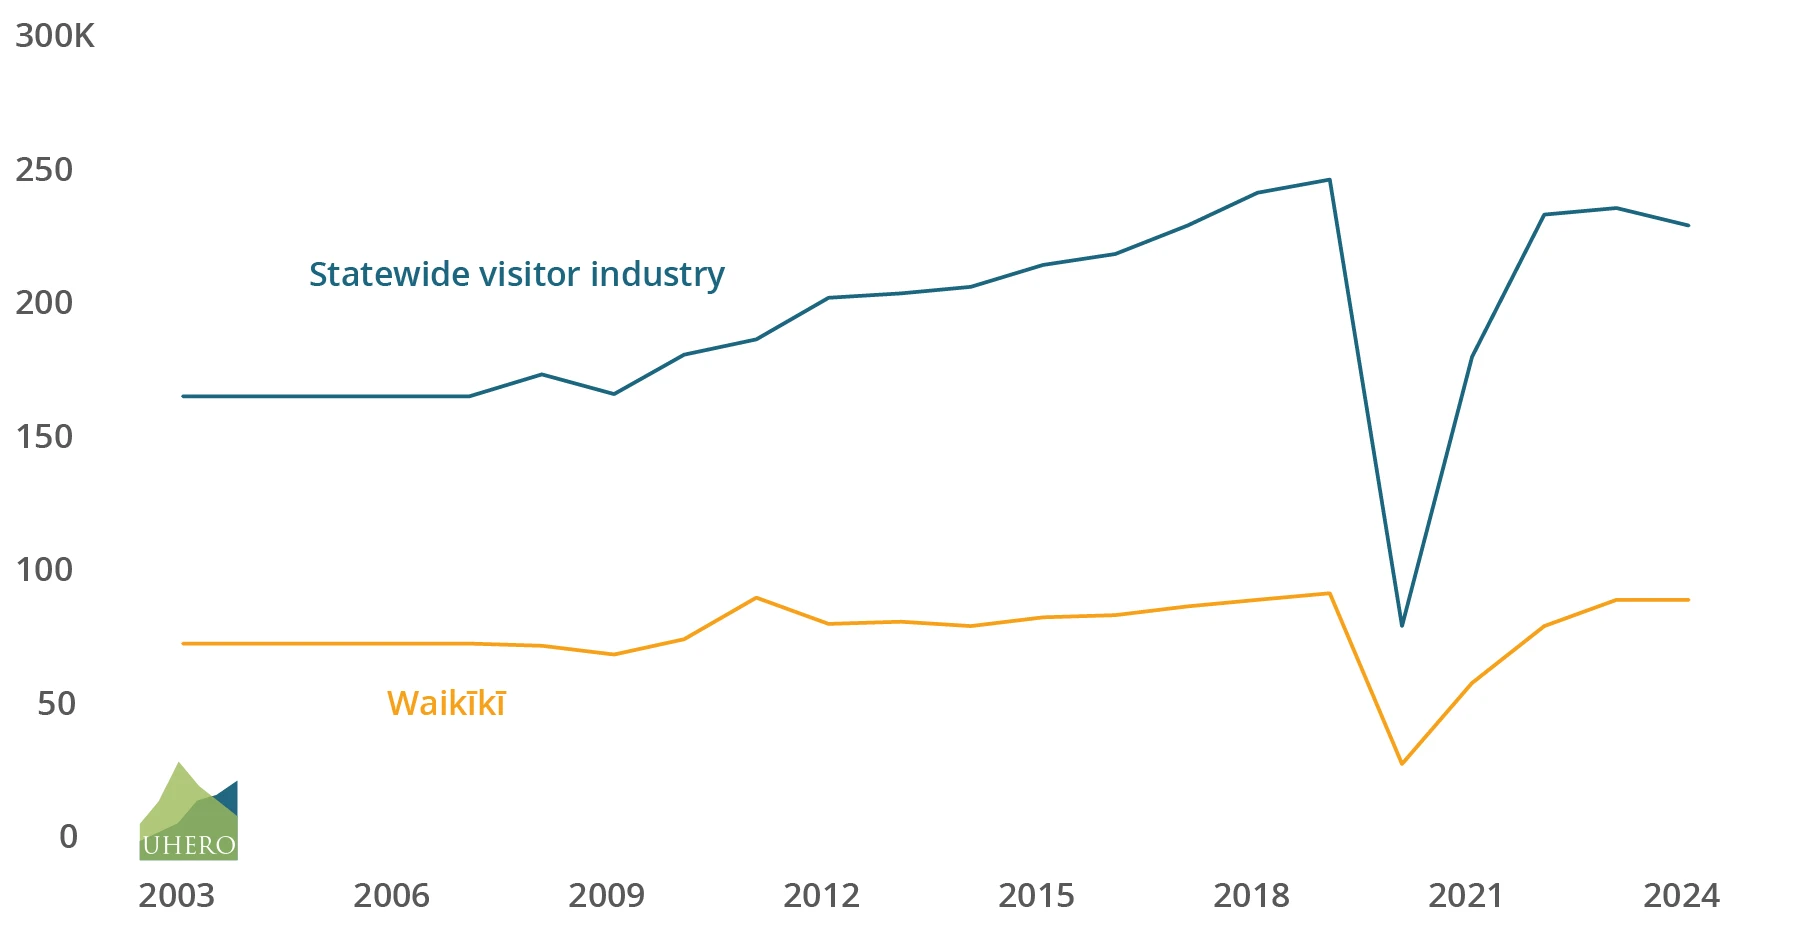
Figure 9. Visitor units, 2003 – 2024 (State of Hawaii Department of Business Economic Development and Tourism (DBEDT), 2025a)
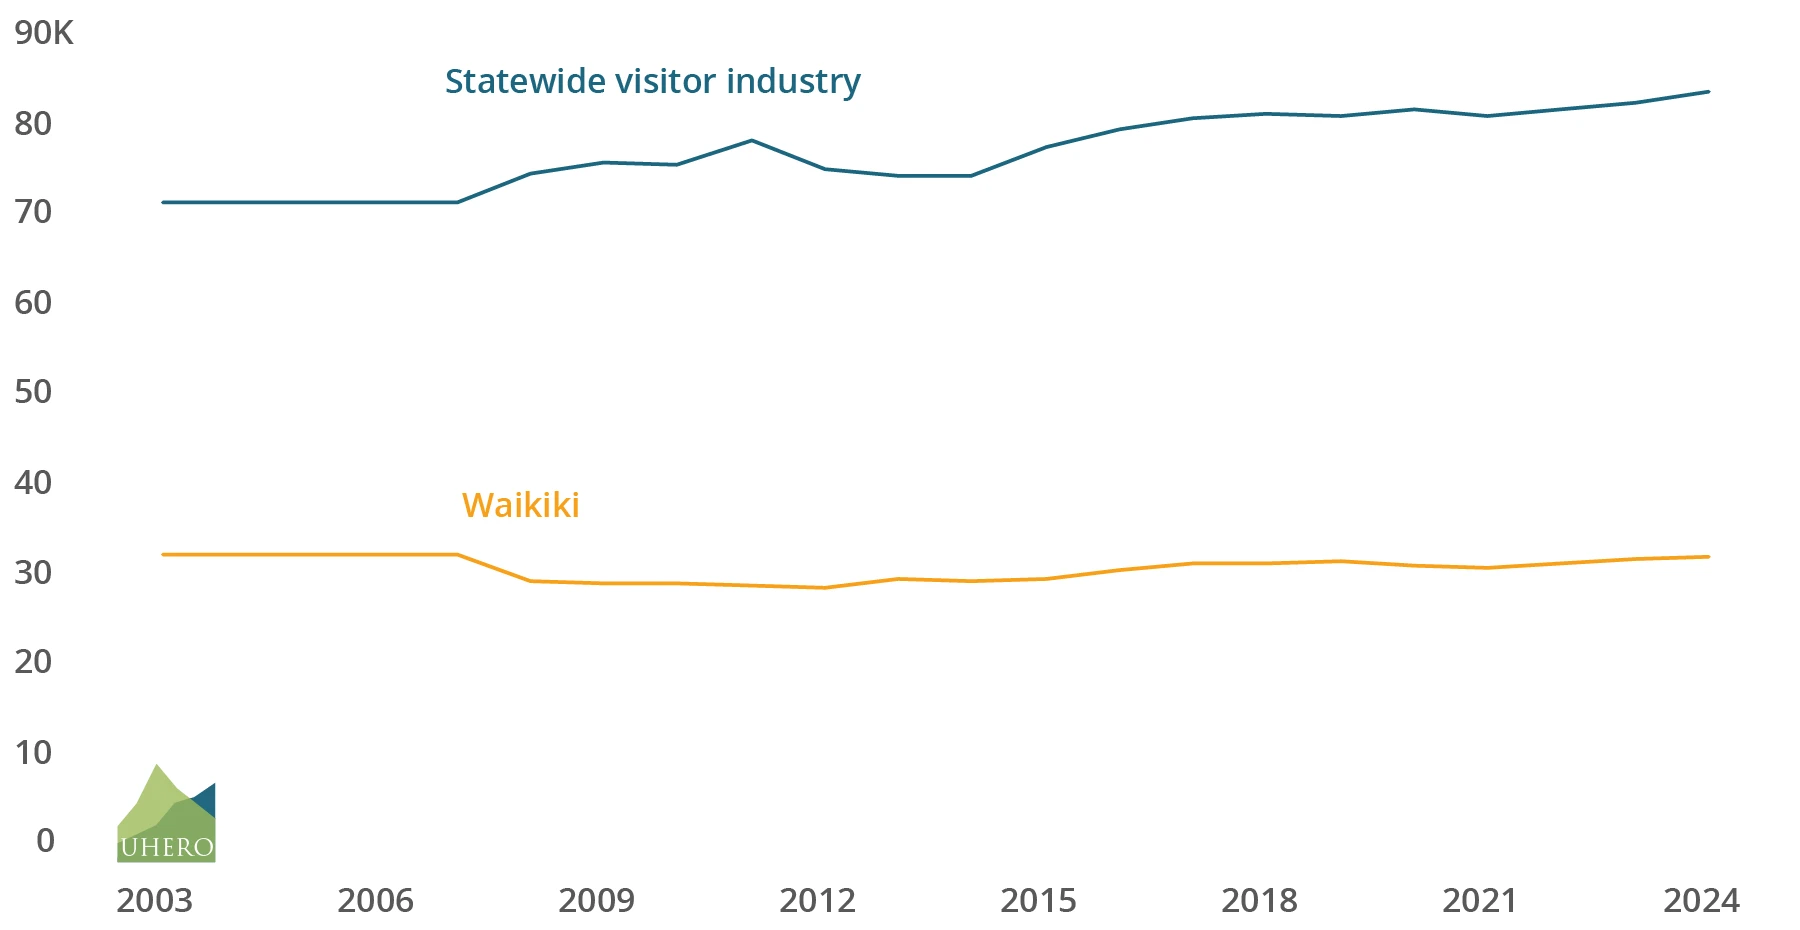
Figure 10. Occupied visitor units, 2003 – 2024 (State of Hawaii Department of Business Economic Development and Tourism (DBEDT), 2025a)
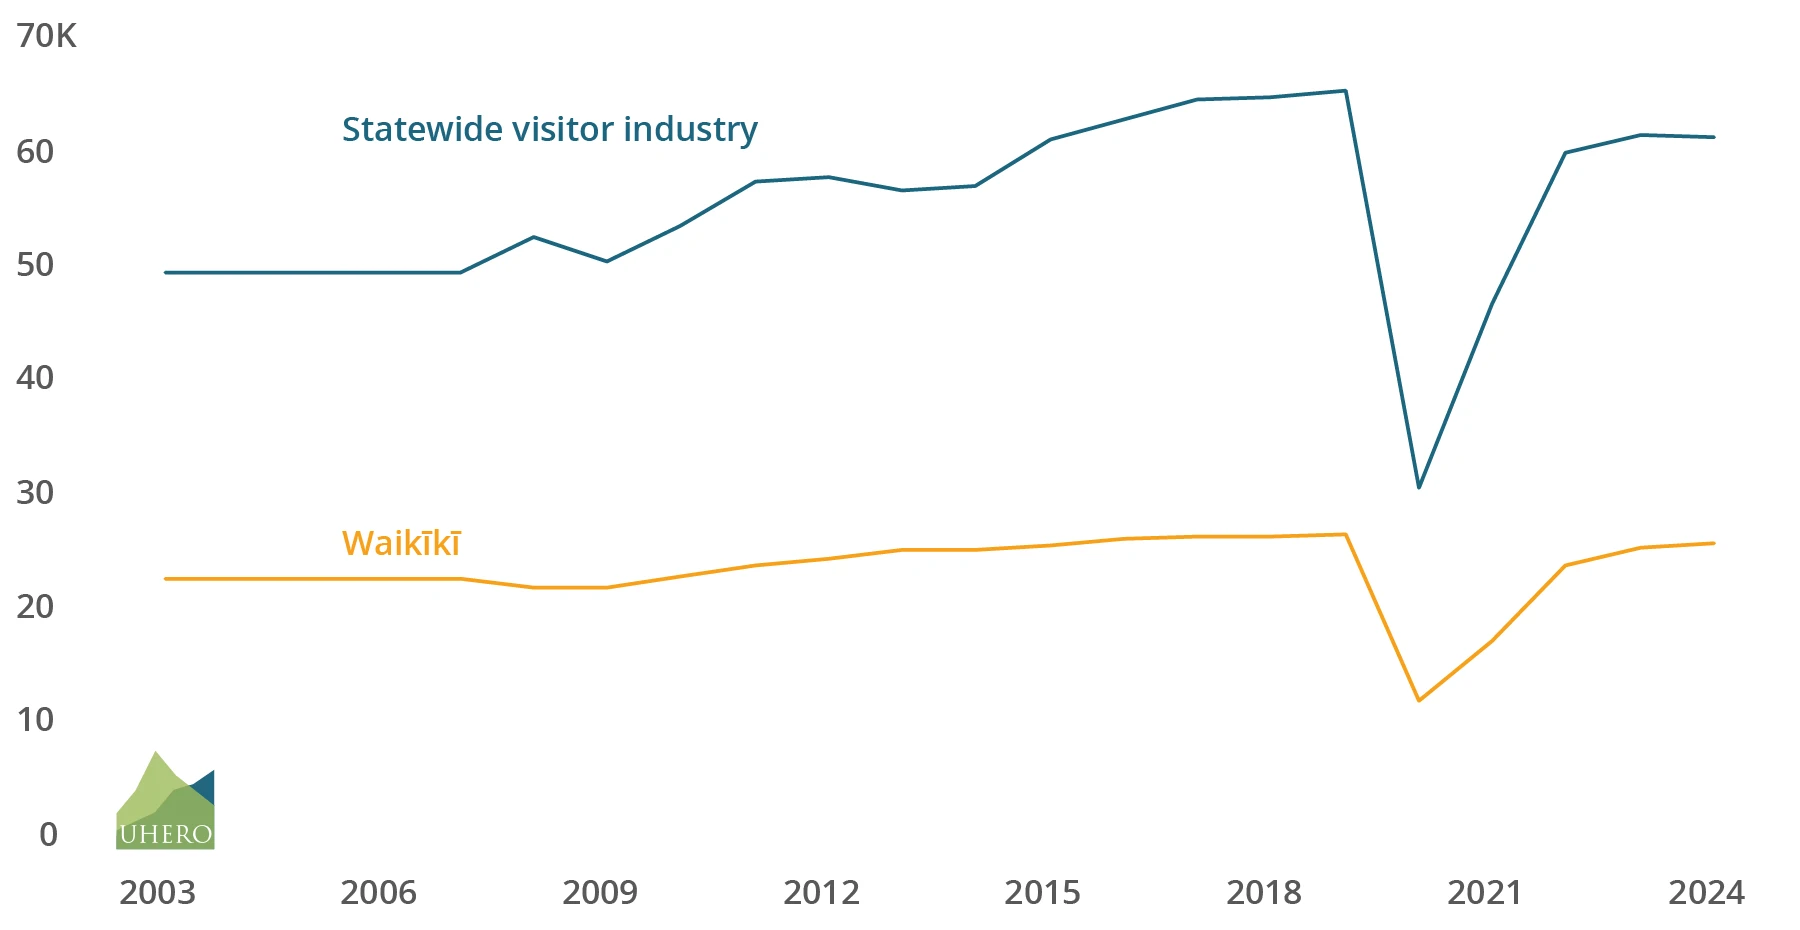
Figure 11. Total visitor expenditures, 2003 – 2024, in nominal terms (State of Hawaii Department of Business Economic Development and Tourism (DBEDT), 2025a)
Accounting for Economic Contributions
The estimated economic contribution of Waikīkī and statewide tourism is shown below (Table 4). Depending on the measure, Waikīkī accounted for between 36% and 42% of statewide tourism in 2024, we use low-end measures in Table 4 for a conservative estimate.
Table 4. Contribution to the State’s Economy by Statewide Visitor Industry and by Waikīkī: 2024
| Contribution of tourism to the state economy | Contribution of Waikīkī tourism to the state economy | |||
| Measure of tourism | Number | Percent | Number | Percent |
| Direct impactA | ||||
| Gross domestic productB | (X) | (X) | (X) | (X) |
| Civilian jobs (1,000)C | 145.4 | 16.2 | 52.9 | 5.9 |
| State taxes ($ millions) | 1,574.2 | 13.5 | 572.7 | 4.9 |
| Direct and indirect impactD | ||||
| Gross domestic product ($ millions) | 18,919.9 | 16.4 | 6,883.4 | 6.0 |
| Civilian jobs (1,000)C | 170.3 | 19.0 | 62.0 | 6.9 |
| State taxes ($ millions) | 2,195.1 | 18.8 | 798.6 | 6.9 |
A Measures the impact of visitor expenditures on only those firms that sell directly to visitors.
B In this Input-Output analysis, direct and indirect GDP are not readily separated.
C Civilian jobs include wage and salary jobs plus self-employed but exclude non-civilian military jobs.
D Measures the impact of visitor expenditures through all firms that contributed to goods and services sold to visitors.
Source: Estimates by Hawai’i Department of Business Economic Development and Tourism (DBEDT) (2025a).
Input-output models represent what is produced across industries and the interactions among them (Tian et al., 2011). Through DBEDT’s input-output model it is estimated that visitor-industry firms (those firms selling goods and services directly to the visitor) accounted for approximately 145,400 jobs in the state during 2024. However, there are a large number of companies that receive visitor dollars indirectly by supplying and servicing visitor-industry firms. Taking into account these firms, it is estimated that in total, more than 170,300 jobs were supported directly and indirectly by visitor expenditures in 2024.
Likewise, visitor-related expenditures generated $1.6 billion in state revenues among visitor industry firms and $2.2 billion among all firms (direct and indirect).
Statewide tourism’s contribution to GSP was about $18.9 billion in 2024[3]. As Table 4 indicates, the contribution of tourism to the GSP is lower than the value of visitor expenditures (Table 3). This is primarily because a portion of the goods and services purchased by visitor expenditures was actually imported from outside the state. That imported portion does not count toward the calculation of GSP.
The contribution to the economy by tourism of $18.9 billion compares to a total Gross State Product for 2024 of $115 billion, meaning that about 16% of Hawai‘i’s GSP for the year was generated by visitor activity. The export of visitor services is the largest single contributor to Hawai‘i’s annual GSP. In 2002, tourism’s contribution of $8.0 billion compared with a total Gross State Product of $46 billion, meaning 17% of that year’s GSP was generated by visitor activity.
Waikīkī Contribution
Waikīkī’s major contribution to the economy is through its role as a resort destination. Based on its share of visitor expenditures in the state for 2024, it is estimated that the Waikīkī resort area accounted for roughly 62,000 jobs statewide (Table A4). About 53,000 of these jobs were in businesses serving the visitor directly. In addition, Waikīkī-based visitor activity generated an estimated $799 million in tax revenues for the state (Table A5).
It is estimated that Waikīkī-based visitor activity accounted for about $6.9 billion or 36% of statewide tourism’s total contribution to GSP in 2024. In terms of its role in the state’s economy as a whole, about 6% of Hawai‘i’s GSP for 2024 can be attributed to visitor activity based in Waikīkī (Table A3).
Limitations
Visitor-related expenditures associated with Waikīkī actually generate more economic activity than this analysis can take into account. That additional activity is generated by the consumer expenditures of workers who make their living directly or indirectly through visitor industry activity. Economists refer to this as the “induced” impact of visitor related expenditures. This impact occurs when employees go out into the community and spend money for groceries, rent, recreation and so forth. This money, in turn, is re-spent by the businesses and employees of those community businesses. As a result, additional income, jobs, taxes and GSP are generated in the state.
As with the original State of Hawaii Department of Business Economic Development and Tourism (DBEDT) (2003) brief, it is a more complex task to accurately capture the magnitude of the induced impact of visitor-related spending on the economy than is possible in this limited study and we do not include such estimates. Nevertheless, it is a very real impact and helps explain why local sales in many communities far from resort destinations may reflect the ups and downs of visitor industry performance.
Just as there are additional economic benefits that are not captured in this analysis, there are also costs to the state, county and community from growth in Waikīkī that are beyond the scope of this analysis. These include the typical costs of critical services and public utilities such as police, fire, water and sewage services, and may also include the environmental and economic cost of dealing with increased congestion, environmental problems, and future capacity of the infrastructure. These costs are common to most sources of economic growth and generic for all economic activity.
Conclusions
Despite the diversification of the visitor industry towards the neighbor islands and other parts of O‘ahu, Waikīkī remains the flagship of the state’s tourism industry with 38% of all visitor units. As an economic asset, Waikīkī’s visitor industry supports approximately 6% of the Gross State Product ($6.9 billion) and even more when one considers the induced impacts such as re-spending of the visitor dollar by employees of tourism-related firms.
Directly and indirectly, the small area of Waikīkī—approximately one square mile—can be associated with supporting 62,000 civilian jobs statewide (7% of the total) and $799 million in state tax revenues (7% of the total). Waikīkī has long been, and continues to be, the economic driver of the state’s leading industry with outsized contributions to the state economy. As induced impacts are not included in this analysis, the estimates presented in this report can be considered as a conservative measure of the benefits of Waikīkī’s tourism economy.
When we consider the export of visitor services, the economic benefits of Waikīkī-based tourism extend well beyond the district itself, supporting jobs, tax revenues, supplier activity, and secondary spending across the state. For this reason, maintaining Waikīkī’s competitiveness, infrastructure, environmental quality, and visitor experience remains a matter of statewide economic significance.
References
State of Hawaii Department of Business Economic Development and Tourism (DBEDT). (2003). The Economic Contribution of Waikiki (dbedt e-reports). https://files.hawaii.gov/dbedt/economic/archive/reports/econ_waikiki.pdf
State of Hawaii Department of Business Economic Development and Tourism (DBEDT). (2025a). 2024 State of Hawai‘i data book. DBEDT Research and Economic Analysis Division. https://dbedt.hawaii.gov/economic/databook/db2024/
State of Hawaii Department of Business Economic Development and Tourism (DBEDT). (2025b). 2025 Visitor Plant Inventory. https://files.hawaii.gov/dbedt/visitor/visitor-plant/2025VPI.pdf
State of Hawaii Department of Business Economic Development and Tourism (DBEDT). (2026). Hotel Performance. https://dbedt.hawaii.gov/visitor/tourismdata/
State of Hawaii Office of Planning. (2022). 2020 Census Tracts. https://files.hawaii.gov/dbedt/economic/databook/maps/2020-census-tracts_Hawaii.pdf
Tian, E., Mak, J., & Leung, P. (2011). The direct and indirect contributions of tourism to regional GDP: Hawaii. https://uhero.hawaii.edu/wp-content/uploads/2019/08/WP_2011-5.pdf
U.S. Census Bureau. (2020). 2020 Decennial Census, Demographic and Housing Characteristics File, Table P1: Total Population, ZIP Code Tabulation Area 96815. U.S. Department of Commerce.
U.S. Census Bureau. (2023). All Sectors: County Business Patterns, including ZIP Code Business Patterns, by Legal Form of Organization and Employment Size Class for the U.S., States, and Selected Geographies: 2023. In CB2300CBP (Ed.), Economic Surveys (pp. ECNSVY Business Patterns County Business Patterns).
U.S. Census Bureau. (2024). Selected Economic Characteristics. In DP03 (Ed.), American Community Survey (pp. ACS 5-Year Estimates Data Profiles).Appendix
Data and Methods
This report makes use of the newest available data at print, from federal, state, and UHERO sources. From the US Census Bureau, the 2020 Census, 2023 County Business Patterns, and 2024 American Community Survey were included; we make use of the DBEDT Hawai‘i data book from 2003 – 2025, DBEDT Visitor Plant Inventory up to 2025, along with DBEDT Hotel Performance up to 2026 (partial year). When dollars are deflated for time series comparison purposes, we make use of the Inflation Rate (Honolulu CPI), based on the US Department of Labor Bureau of Labor Statistics Inflation Rate (Honolulu CPI) (State of Hawai‘i – Annual).
Additional Figures
Figure A1. Direct impact: Civilian jobs, 2003 – 2024. Shown as number of jobs (left) and percent share (right) (State of Hawaii Department of Business Economic Development and Tourism (DBEDT), 2025a)
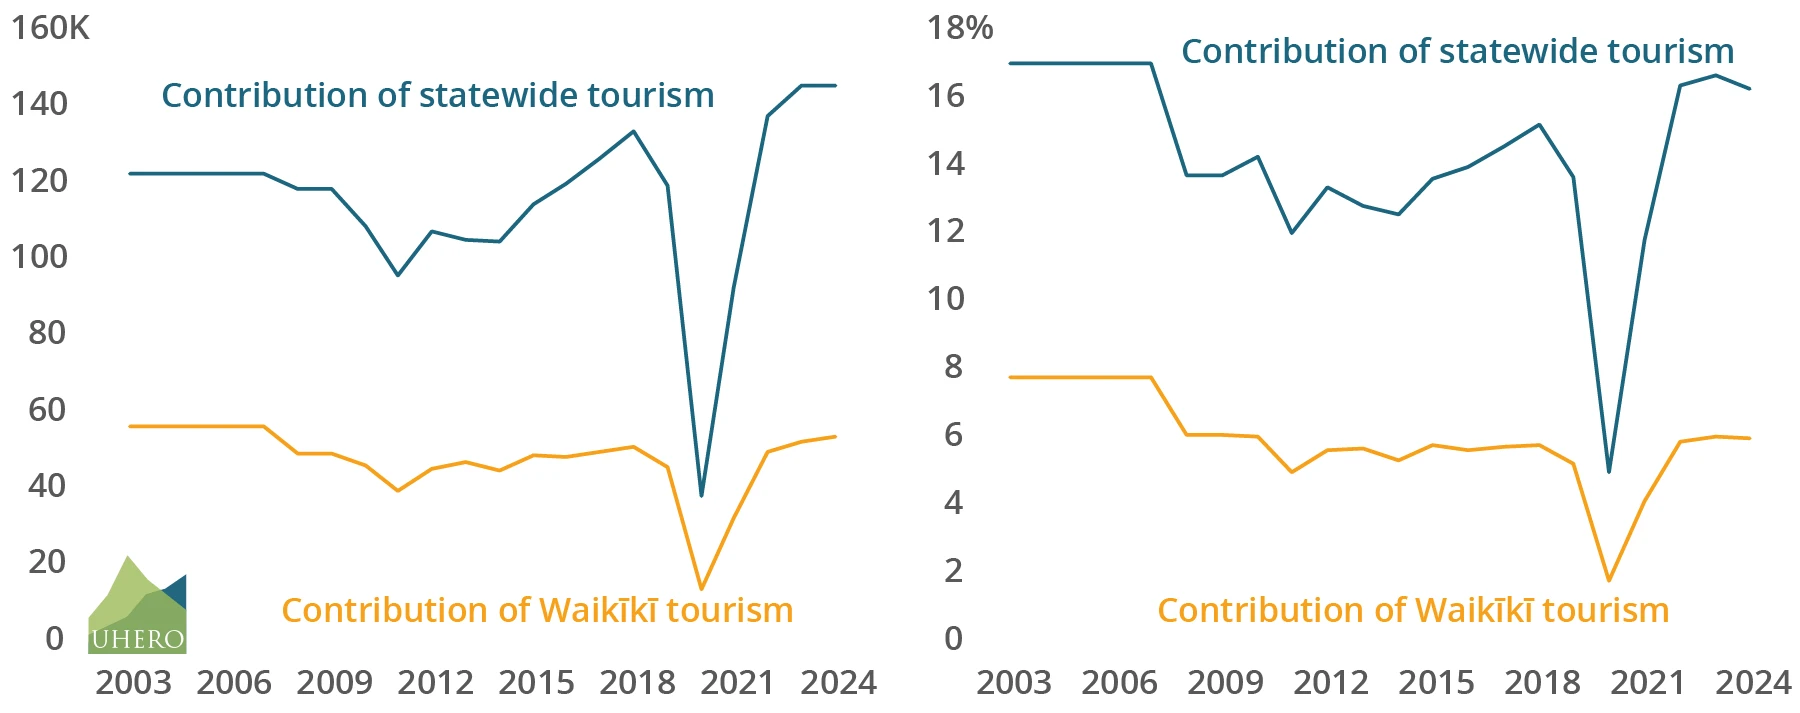
Figure A2. Direct impact: State tax revenue, 2003 – 2024. Shown as dollars of tax revenue (left, in nominal terms) and percent share (right) (State of Hawaii Department of Business Economic Development and Tourism (DBEDT), 2025a)
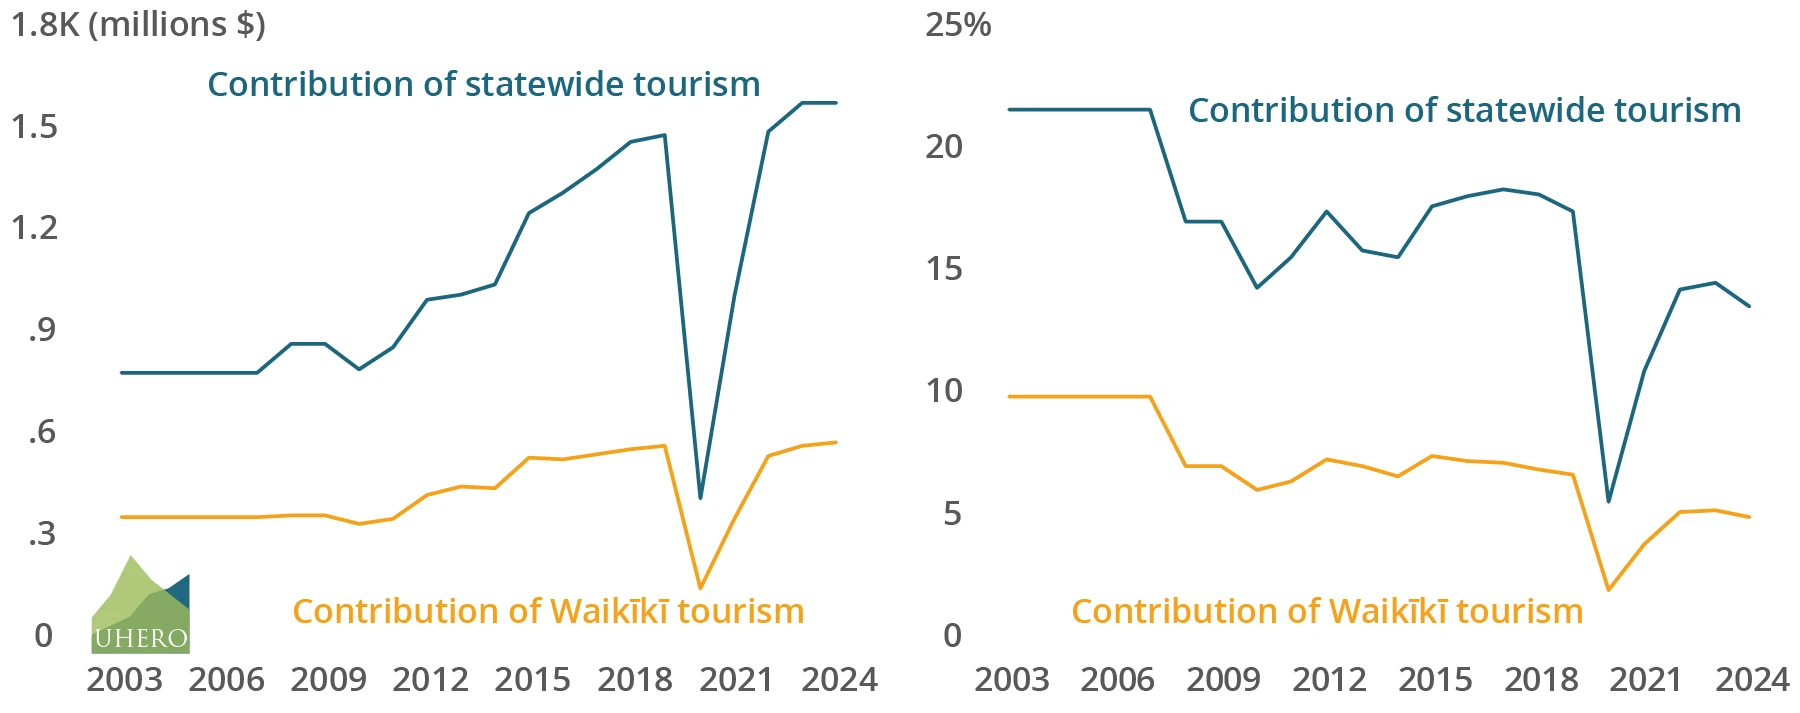
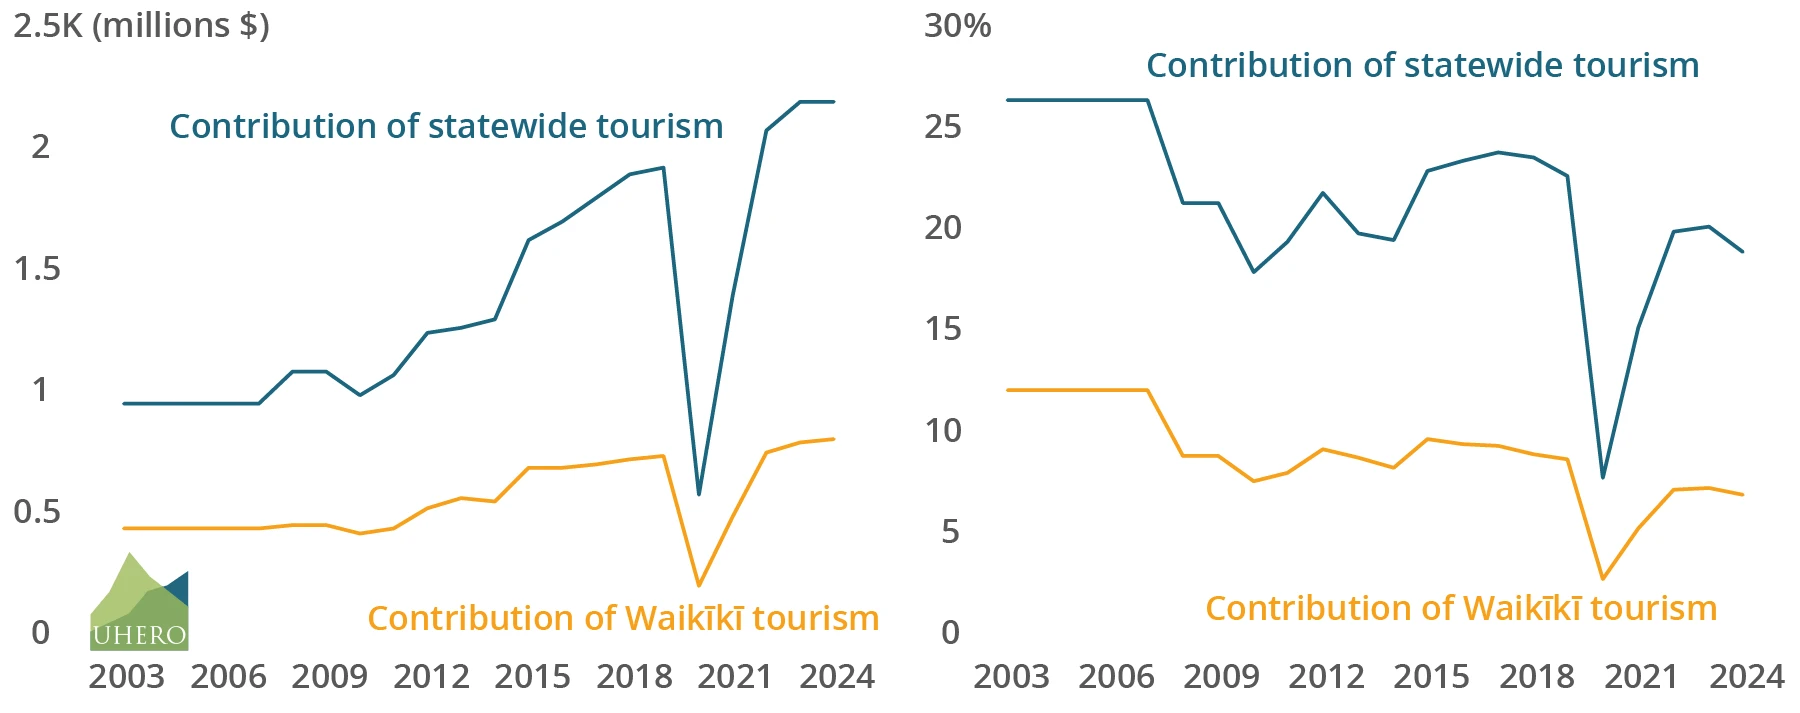
Figure A3. Direct and indirect impact: Hawai‘i GDP, 2003 – 2024. Shown as millions of dollars (left, in nominal terms) and percent share (right) (State of Hawaii Department of Business Economic Development and Tourism (DBEDT), 2025a)
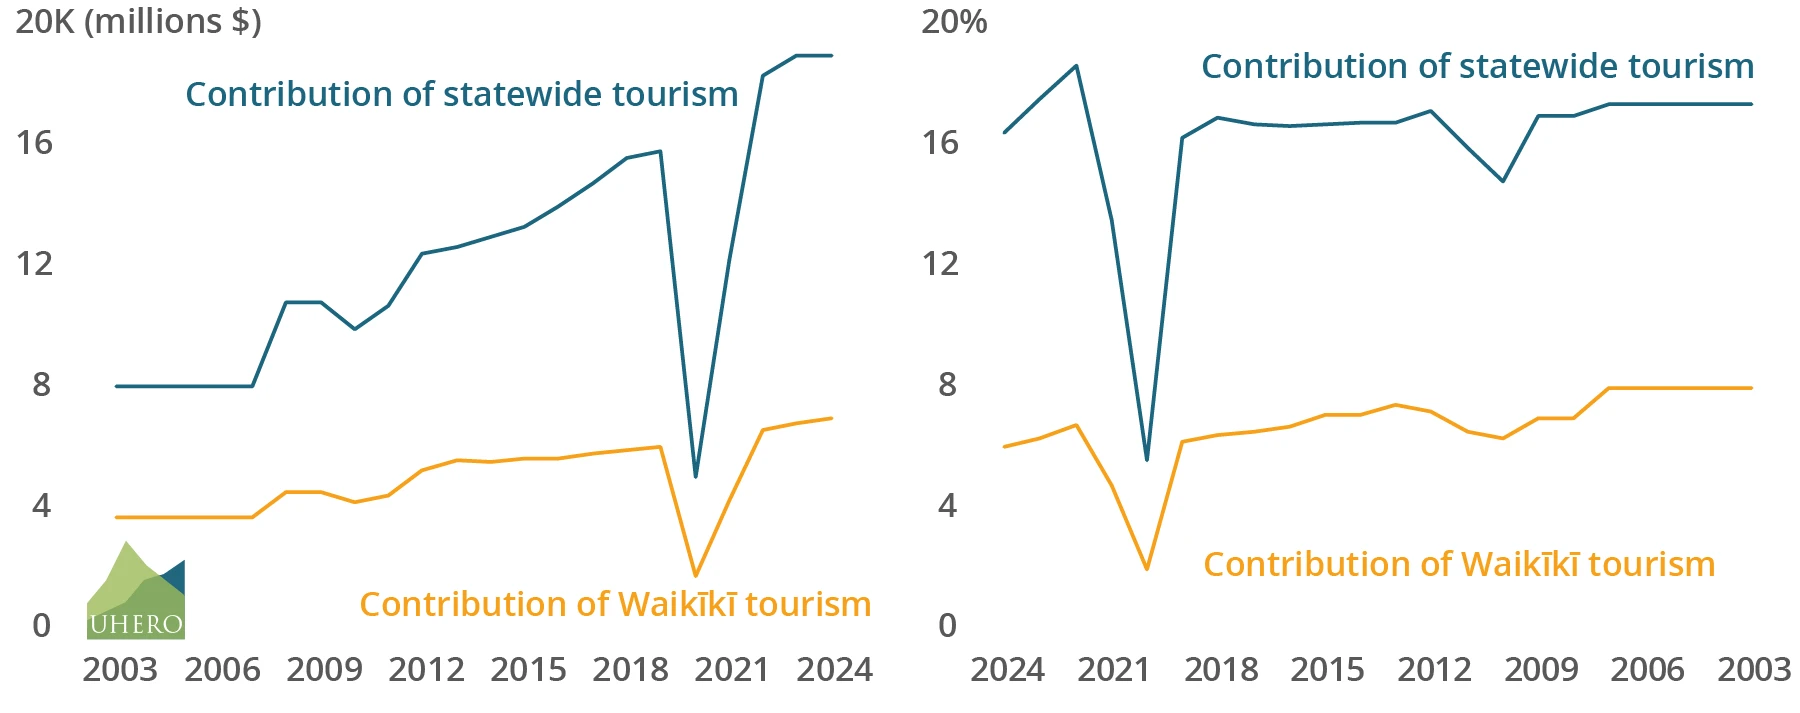
Figure A4. Direct and indirect impact: Civilian jobs, 2003 – 2024. Shown as number of jobs (left) and percent share (right) (State of Hawaii Department of Business Economic Development and Tourism (DBEDT), 2025a)
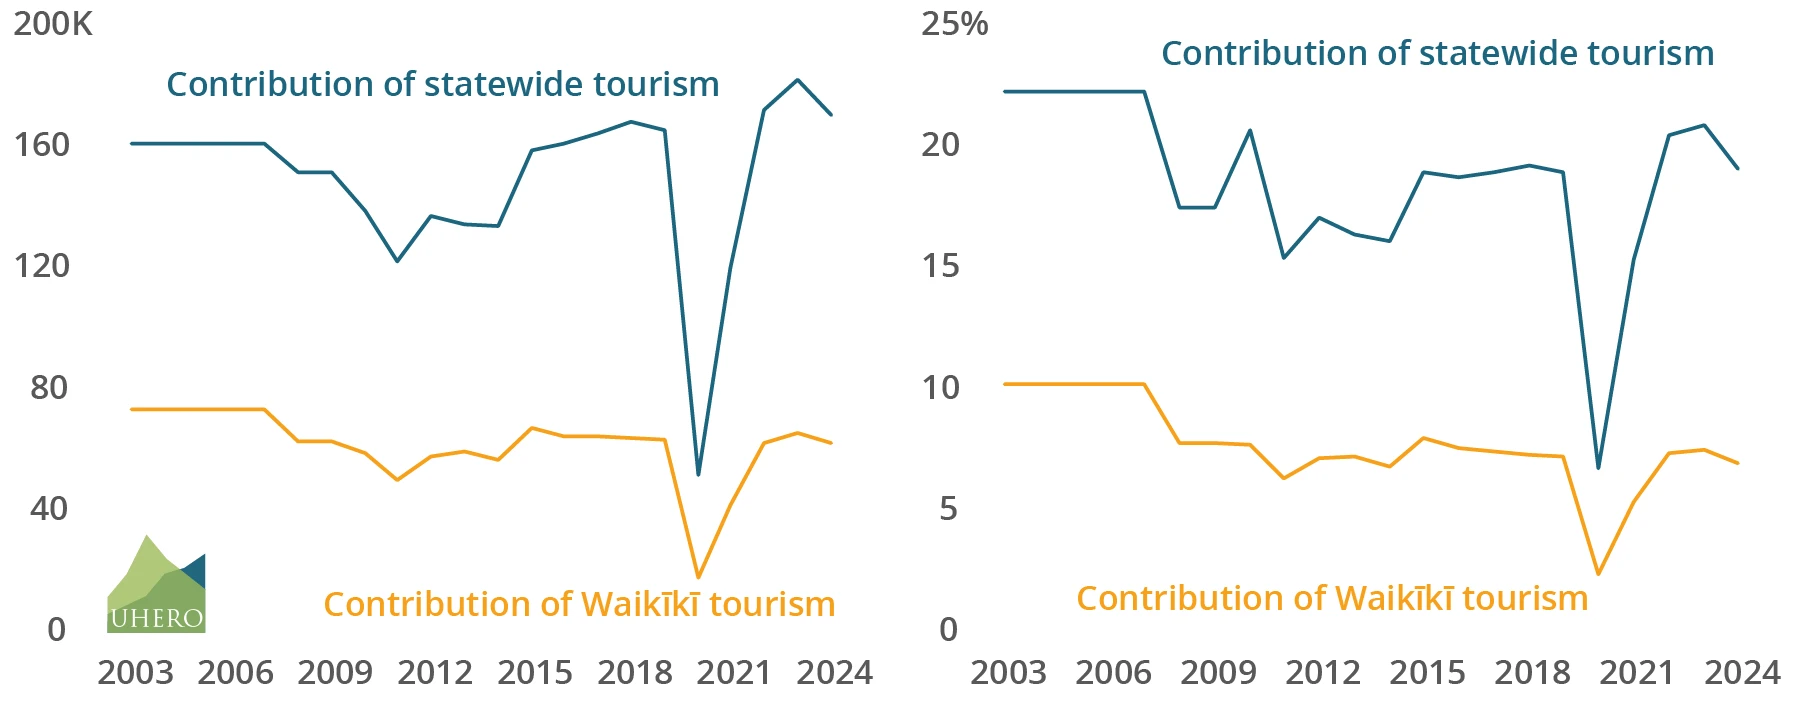
Figure A5. Direct and indirect impact: State tax revenue, 2003 – 2024. Shown as dollars of tax revenue (left, in nominal terms) and percent share (right) (State of Hawaii Department of Business Economic Development and Tourism (DBEDT), 2025a)
Additional Tables
Table A1. Room rates, 1990 – 2025, in nominal terms (State of Hawaii Department of Business Economic Development and Tourism (DBEDT), 2026)
| Statewide RevPAR | Statewide ADR | Statewide Occupancy | Waikīkī RevPAR | Waikīkī ADR | Waikīkī Occupancy | |
| 2025 | $271.55 | $366.63 | 73.9 | $213.12 | $267.87 | 79.4 |
| 2024 | $267.44 | $364.67 | 73.3 | $217.99 | $271.17 | 80.4 |
| 2023 | $282.10 | $377.55 | 74.7 | $215.21 | $268.69 | 80.1 |
| 2022 | $274.27 | $372.86 | 73.6 | $192.83 | $253.88 | 76 |
| 2021 | $189.89 | $330.32 | 57.5 | $116.97 | $212.07 | 55.2 |
| 2020 | $100.21 | $266.81 | 37.6 | $80.68 | $214.56 | 37.6 |
| 2019 | $228.78 | $283.05 | 80.8 | $199.53 | $236.15 | 84.5 |
| 2018 | $221.34 | $275.75 | 80.3 | $194.75 | $231.46 | 84.1 |
| 2017 | $212.07 | $264.49 | 80.2 | $192.63 | $228.45 | 84.3 |
| 2016 | $201.64 | $254.84 | 79.1 | $192.97 | $225.74 | 85.5 |
| 2015 | $192.39 | $244.55 | 78.7 | N/A | N/A | N/A |
| 2014 | $180.83 | $234.85 | 77 | N/A | N/A | N/A |
| 2013 | $175.87 | $229.90 | 76.5 | N/A | N/A | N/A |
| 2012 | $157.59 | $204.93 | 76.9 | N/A | N/A | N/A |
| 2011 | $138.96 | $189.83 | 73.2 | N/A | N/A | N/A |
| 2010 | $123.61 | $174.84 | 70.7 | N/A | N/A | N/A |
| 2009 | $114.76 | $177.10 | 64.8 | N/A | N/A | N/A |
| 2008 | $142.30 | $201.85 | 70.5 | N/A | N/A | N/A |
| 2007 | $149.97 | $199.96 | 75 | N/A | N/A | N/A |
| 2006 | $148.82 | $187.19 | 79.5 | N/A | N/A | N/A |
| 2005 | $135.49 | $166.86 | 81.2 | N/A | N/A | N/A |
| 2004 | $118.24 | $152.17 | 77.7 | N/A | N/A | N/A |
| 2003 | $104.85 | $144.16 | 72.7 | N/A | N/A | N/A |
| 2002 | $98.10 | $140.54 | 69.8 | N/A | N/A | N/A |
| 2001 | $100.26 | $144.88 | 69.2 | N/A | N/A | N/A |
| 2000 | $107.56 | $140.58 | 76.5 | N/A | N/A | N/A |
| 1999 | $94.93 | $131.66 | 72.1 | N/A | N/A | N/A |
| 1998 | $92.32 | $128.66 | 71.7 | N/A | N/A | N/A |
| 1997 | $92.23 | $124.64 | 73.9 | N/A | N/A | N/A |
| 1996 | $87.60 | $116.17 | 75.3 | N/A | N/A | N/A |
| 1995 | $83.17 | $109.36 | 76 | N/A | N/A | N/A |
| 1994 | $80.72 | $104.95 | 76.9 | N/A | N/A | N/A |
| 1993 | $74.72 | $103.11 | 72.4 | N/A | N/A | N/A |
| 1992 | $77.01 | $104.52 | 73.7 | N/A | N/A | N/A |
| 1991 | $73.50 | $101.17 | 72.8 | N/A | N/A | N/A |
| 1990 | $80.32 | $101.90 | 78.7 | N/A | N/A | N/A |
Table A2. Room rates, 1990 – 2025, adjusted for inflation (shown in 2002 dollars) (State of Hawaii Department of Business Economic Development and Tourism (DBEDT), 2025a)
| Statewide RevPAR | Statewide ADR | Waikīkī RevPAR | Waikīkī ADR | |
| 2025 | $140.22 | $189.32 | $110.05 | $138.32 |
| 2024 | $141.69 | $193.20 | $115.49 | $143.67 |
| 2023 | $156.03 | $208.83 | $119.04 | $148.62 |
| 2022 | $156.41 | $212.63 | $109.96 | $144.78 |
| 2021 | $115.33 | $200.61 | $71.04 | $128.80 |
| 2020 | $63.17 | $168.20 | $50.86 | $135.26 |
| 2019 | $146.53 | $181.29 | $127.80 | $151.25 |
| 2018 | $144.04 | $179.44 | $126.73 | $150.62 |
| 2017 | $140.49 | $175.21 | $127.61 | $151.34 |
| 2016 | $137.05 | $173.21 | $131.16 | $153.43 |
| 2015 | $133.38 | $169.54 | N/A | N/A |
| 2014 | $126.62 | $164.44 | N/A | N/A |
| 2013 | $124.87 | $163.23 | N/A | N/A |
| 2012 | $113.90 | $148.12 | N/A | N/A |
| 2011 | $102.85 | $140.50 | N/A | N/A |
| 2010 | $94.87 | $134.19 | N/A | N/A |
| 2009 | $89.93 | $138.78 | N/A | N/A |
| 2008 | $112.07 | $158.97 | N/A | N/A |
| 2007 | $123.19 | $164.25 | N/A | N/A |
| 2006 | $128.23 | $161.30 | N/A | N/A |
| 2005 | $123.52 | $152.12 | N/A | N/A |
| 2004 | $111.89 | $144.00 | N/A | N/A |
| 2003 | $102.49 | $140.92 | N/A | N/A |
| 2002 | $98.10 | $140.54 | N/A | N/A |
| 2001 | $101.26 | $146.33 | N/A | N/A |
| 2000 | $109.94 | $143.69 | N/A | N/A |
| 1999 | $98.78 | $136.99 | N/A | N/A |
| 1998 | $97.02 | $135.21 | N/A | N/A |
| 1997 | $96.64 | $130.59 | N/A | N/A |
| 1996 | $92.43 | $122.57 | N/A | N/A |
| 1995 | $89.07 | $117.12 | N/A | N/A |
| 1994 | $88.35 | $114.87 | N/A | N/A |
| 1993 | $84.07 | $116.01 | N/A | N/A |
| 1992 | $89.42 | $121.36 | N/A | N/A |
| 1991 | $89.53 | $123.23 | N/A | N/A |
| 1990 | $104.78 | $132.93 | N/A | N/A |
Table A3. Gross domestic product ($ millions), 2003 – 2024 (State of Hawaii Department of Business Economic Development and Tourism (DBEDT), 2025a)
| Contribution of statewide tourism (Number) | Contribution of statewide tourism (Percent) | Contribution of Waikīkī tourism (Number) | Contribution of Waikīkī tourism (Percent) | |
| 2024 | 18,919.9 | 16.4 | 6,883.4 | 6.0 |
| 2023 | 18,907.4 | 17.5 | 6,756.0 | 6.3 |
| 2022 | 18,265.3 | 18.6 | 6,543.1 | 6.7 |
| 2021 | 12,159.6 | 13.5 | 4,196.9 | 4.7 |
| 2020 | 4,939 | 5.5 | 1,701 | 1.9 |
| 2019 | 15,754 | 16.2 | 5,980 | 6.1 |
| 2018 | 15,511 | 16.9 | 5,851 | 6.4 |
| 2017 | 14,692 | 16.7 | 5,720 | 6.5 |
| 2016 | 13,915 | 16.6 | 5,566 | 6.6 |
| 2015 | 13,278 | 16.7 | 5,586 | 7.0 |
| 2014 | 12,914 | 16.7 | 5,444 | 7.0 |
| 2013 | 12,569 | 16.7 | 5,532 | 7.4 |
| 2012 | 12,370 | 17.1 | 5,173 | 7.1 |
| 2011 | 10,627 | 15.9 | 4,339 | 6.5 |
| 2010 | 9,869 | 14.8 | 4,151 | 6.2 |
| 2009 | N/A | N/A | N/A | N/A |
| 2008 | 10,770 | 16.9 | 4,437 | 6.9 |
| 2007 | N/A | N/A | N/A | N/A |
| 2006 | N/A | N/A | N/A | N/A |
| 2005 | N/A | N/A | N/A | N/A |
| 2004 | N/A | N/A | N/A | N/A |
| 2003 | 7,974 | 17.3 | 3,628 | 7.9 |
Table A4. Civilian jobs, 2003 – 2024 (State of Hawaii Department of Business Economic Development and Tourism (DBEDT), 2025a)
| Contribution of statewide tourism (Number) | Contribution of statewide tourism (Percent) | Contribution of Waikīkī tourism (Number) | Contribution of Waikīkī tourism (Percent) | |
| 2024 | 170,332.0 | 19.0 | 61,969.9 | 6.9 |
| 2023 | 182,227.0 | 20.9 | 65,113.7 | 7.5 |
| 2022 | 172,115.2 | 20.5 | 61,656.0 | 7.3 |
| 2021 | 119,953.0 | 15.3 | 41,401.6 | 5.3 |
| 2020 | 51,074 | 6.7 | 17,587 | 2.3 |
| 2019 | 165,266 | 18.9 | 62,735 | 7.2 |
| 2018 | 168,070 | 19.2 | 63,403 | 7.2 |
| 2017 | 164,095 | 18.9 | 63,890 | 7.4 |
| 2016 | 160,835 | 18.7 | 64,331 | 7.5 |
| 2015 | 158,645 | 18.9 | 66,742 | 8.0 |
| 2014 | 133,456 | 16.0 | 56,265 | 6.8 |
| 2013 | 134,233 | 16.4 | 59,080 | 7.2 |
| 2012 | 136,928 | 17.1 | 57,265 | 7.1 |
| 2011 | 121,786 | 15.4 | 49,727 | 6.3 |
| 2010 | 138,619 | 20.7 | 58,359 | 7.7 |
| 2009 | N/A | N/A | N/A | N/A |
| 2008 | 151,331 | 17.5 | 62,348 | 7.7 |
| 2007 | N/A | N/A | N/A | N/A |
| 2006 | N/A | N/A | N/A | N/A |
| 2005 | N/A | N/A | N/A | N/A |
| 2004 | N/A | N/A | N/A | N/A |
| 2003 | 160,787 | 22.3 | 73,158 | 10.2 |
Table A5. State tax revenue ($ millions), 2003 – 2024 (State of Hawaii Department of Business Economic Development and Tourism (DBEDT), 2025a)
| Contribution of statewide tourism (Number) | Contribution of statewide tourism (Percent) | Contribution of Waikīkī tourism (Number) | Contribution of Waikīkī tourism (Percent) | |
| 2024 | 2,195.1 | 18.8 | 798.6 | 6.9 |
| 2023 | 2,193.6 | 20.1 | 783.8 | 7.2 |
| 2022 | 2,071.9 | 19.8 | 742.2 | 7.1 |
| 2021 | 1,395.4 | 15.1 | 481.6 | 5.2 |
| 2020 | 569 | 7.7 | 196 | 2.7 |
| 2019 | 1,923 | 22.6 | 730 | 8.6 |
| 2018 | 1,894 | 23.6 | 714 | 8.9 |
| 2017 | 1,794 | 23.8 | 698 | 9.3 |
| 2016 | 1,699 | 23.4 | 679 | 9.4 |
| 2015 | 1,621 | 22.9 | 682 | 9.6 |
| 2014 | 1,295 | 19.4 | 546 | 8.2 |
| 2013 | 1,260 | 19.8 | 555 | 8.7 |
| 2012 | 1,240 | 21.8 | 519 | 9.1 |
| 2011 | 1,066 | 19.4 | 435 | 7.9 |
| 2010 | 982 | 17.9 | 413 | 7.5 |
| 2009 | N/A | N/A | N/A | N/A |
| 2008 | 1,076 | 21.3 | 443 | 8.8 |
| 2007 | N/A | N/A | N/A | N/A |
| 2006 | N/A | N/A | N/A | N/A |
| 2005 | N/A | N/A | N/A | N/A |
| 2004 | N/A | N/A | N/A | N/A |
| 2003 | 949 | 26.4 | 432 | 12.0 |
[1] This corresponds to 2020 Census Tracts; 18.01, 18.03-18.04, 19.01, 19.05-19.07, 20.03-20.06.
[2] 2023: ECNSVY Business Patterns County Business Patterns, U.S. Census Bureau. The 96815 ZIP Code includes the narrowly defined Waikīkī area (census tracts 18.01 through 20.06) and a large part of the Kapahulu area (Census Tracts 17, 16 and parts of 15). However, compared to the Waikīkī area, the Kapahulu business area is small and located primarily along Kapahulu avenue. Its inclusion in the data on Waikīkī, therefore, does not substantially inflate the measure of Waikīkī business activity.
[3] This loosely represents a combination of the direct and indirect contribution to GSP. For technical reasons the direct contribution of tourism alone is more complicated to estimate in the Input-Output framework than the direct & indirect combination.
Tarui, N., Peng, M., & Eversole, D. (2026). The Economic Contribution of Waikīkī (2026 Update). UHERO. https://uhero.hawaii.edu/the-economic-contribution-of-waikiki-2026-update/
Tarui, Nori, et al. "The Economic Contribution of Waikīkī (2026 Update)." UHERO, 14 October 2026, https://uhero.hawaii.edu/the-economic-contribution-of-waikiki-2026-update/.
Nori Tarui, Marcus Peng, and Dolan Eversole. "The Economic Contribution of Waikīkī (2026 Update)." UHERO, October 14, 2026. https://uhero.hawaii.edu/the-economic-contribution-of-waikiki-2026-update/.
@techreport{tarui2026,
  author  = {Nori Tarui, Marcus Peng, Dolan Eversole},
  title   = {The Economic Contribution of Waikīkī (2026 Update)},
  year    = {2026},
  month   = {October},
  institution = {University of Hawaiʻi Economic Research Organization},
  type        = {UHERO Research},
  url     = {https://uhero.hawaii.edu/the-economic-contribution-of-waikiki-2026-update/}
}UHERO gratefully acknowledges the supporters whose contributions make this work possible.