By Sherilyn Wee, Makena Coffman and Sumner LaCroix
Electric vehicles (EVs) can be a cleaner means of transportation compared to cars with traditional gasoline engines. They have the added benefit of being able to provide support to the electric power grid—an increasingly important attribute in states like Hawaii with high levels of intermittent renewable energy. To achieve widespread deployment of EVs, we need to know why consumers choose to buy an EV rather than a traditional car. Towards this end, we have conducted two studies that evaluate the effects of state-level policy incentives in the United States and that estimate “spillover effects” from geographic peers in Hawaii who purchase EVs. Preliminary results are presented below.
State EV Policies
Though EV battery costs have fallen rapidly in the last several years, the upfront cost of EVs still remain a barrier to rapid adoption. States have implemented a range of policies to encourage consumers to purchase EVs—financial and otherwise—but it is unclear how effective these policies are at achieving additional EV uptake. We estimate the effect of policy on EV adoption using semi-annual new vehicle registrations by EV model from 2010 to 2015 and a rich dataset of consumer-oriented state-level policies designed to promote EV purchases. We focus our policy analysis on EV vehicle purchase incentives and a range of other policies like home charge subsidies, reduced vehicle license taxes or registration fees, time-of-use rates, emissions inspection exemptions, high occupancy vehicle lane exemptions, designated and free parking, and an annual EV fee (that discourages EV purchase). As a rough indicator capturing the overall number of policies that states have used to incentivize consumer EV adoption, we add the number of policies up by state, illustrated in Figure 1. We separate the “policy index” (ranging from 0 to 9) by battery electric vehicles (BEVs) and plug-in hybrid electric vehicles (PHEVs) and show how it has changed over time (as shown in Figure 1 for the second half of 2011, 2013, 2015). Overall, there are more BEV policies, where California and Arizona are leaders in the number of EV policies adopted.
Figure 1. State Policy Index: BEVs (top) and PHEVs (bottom)
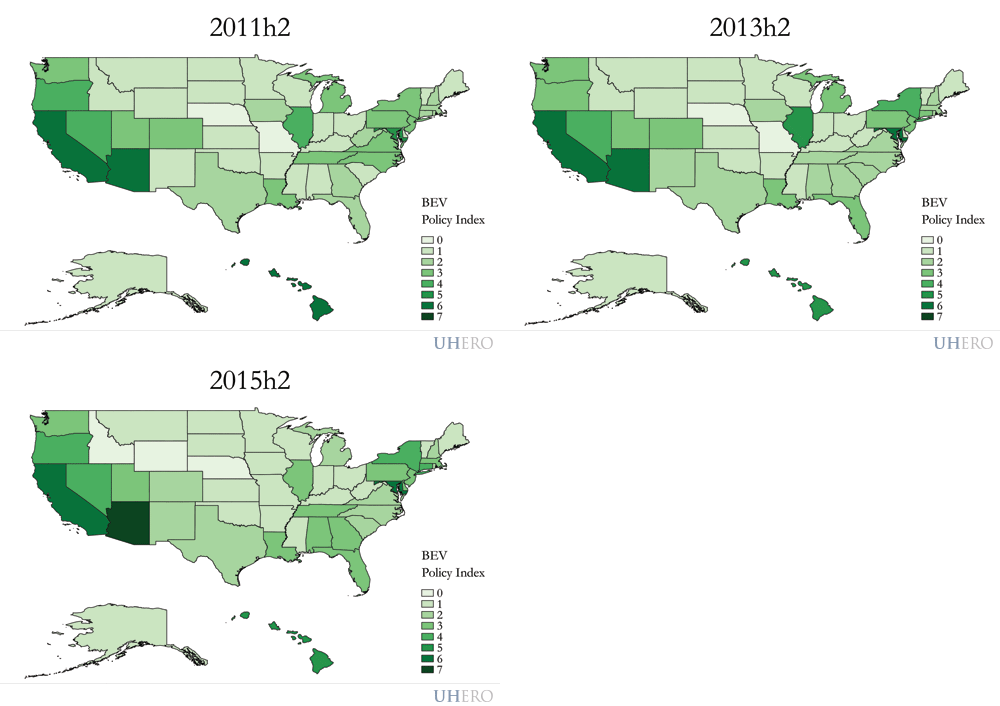
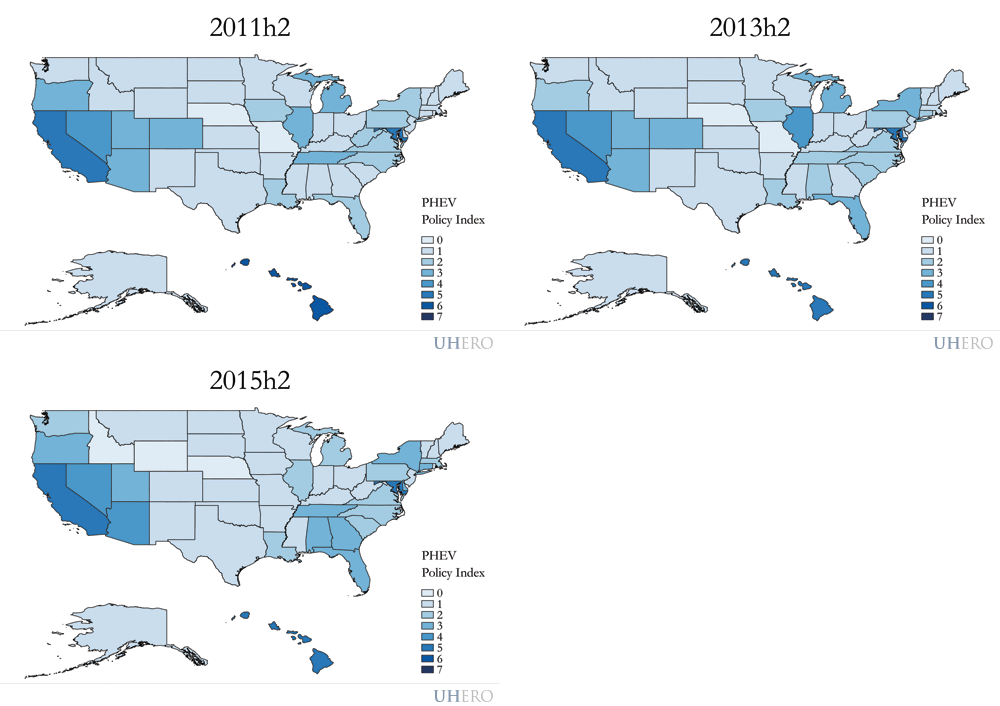

Our econometric estimates show that state policies positively impact EV adoption for both BEVs and PHEVs. The vehicle purchase incentive has a pronounced effect on BEV uptake. A $1,000 increase in the purchase incentive leads to an approximately 15% increase in sales of BEVs. We test these results by examining states that have ended large purchase subsidies, and find that BEV adoption declines. Other policies—aggregated together into a policy index—likewise increase EV uptake, though more so for PHEVs. This suggests that policies related to usage are perhaps more relevant for PHEVs. Each additional policy increases PHEV sales by 18%. The contrast between the effectiveness of different types of incentives for BEVs and PHEVs offers some guidance for policymakers evaluating current state policies or considering adopting new state EV policies. In sum, we find that state policies have driven additional EV uptake—extending EV purchases to consumers who would not have otherwise entered the market.
Geographic Peer Effects for Teslas
We also examine the role of geographic peers in EV uptake in Hawaii. Hawaii provides an excellent case for studying peer effects because it has strong EV adoption, the second highest amongst U.S. states in EVs per capita (IHS Markit, U.S. Census Bureau, 2010 – 2015). Although federal and state governments offer a variety of consumer incentives, the decision to adopt EVs may also extend beyond economic and policy motivations to include behavioral and social components. Social networks, also called “peer effects,” could have a potentially large influence on vehicle choice if people are influenced in their decision to adopt an EV by peer decisions to adopt EVs. Our second study examines peer effects defined by geographic networks, i.e., by visual observations of EVs registered in one’s neighborhood. Using zip code-level EV registration data from 2013-2016 for Hawaii, we exploit a three-month gap between adoption decisions and deliveries of Teslas to estimate presence and size of peer effects. Tesla EVs were important for reigniting interest in EVs more generally and amount to 13% of registered EVs on Maui, Oahu, and Hawaii Island. Our econometric analysis identifies statistically significant neighborhood effects. Figures 2 and 3 illustrate EV and Tesla uptake, respectively, by zipcode on Oahu, Maui, and Hawaii Island; Kauai is omitted due to data limitations.
Figure 2. EV Adoption on Oahu, Maui and Hawaii Island
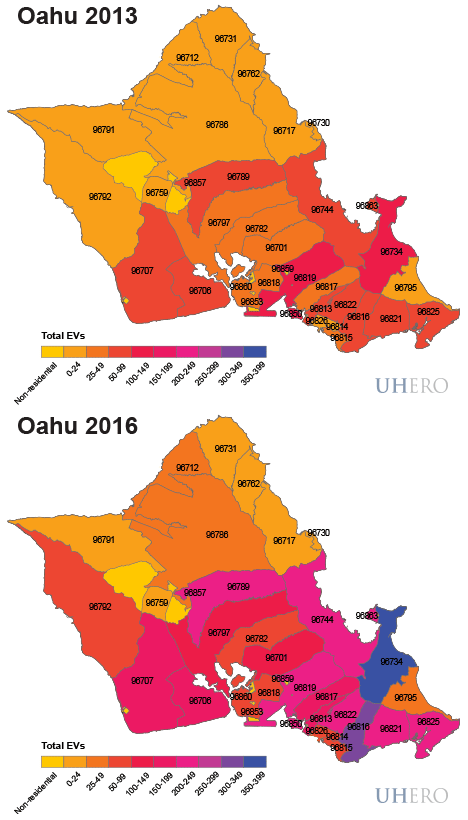

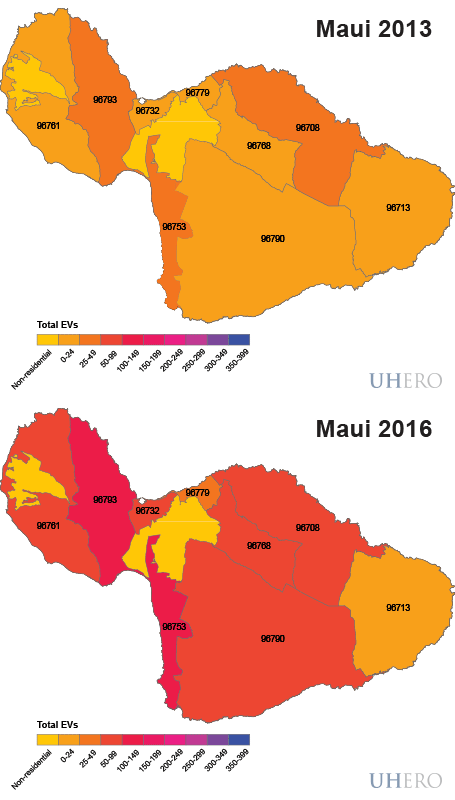

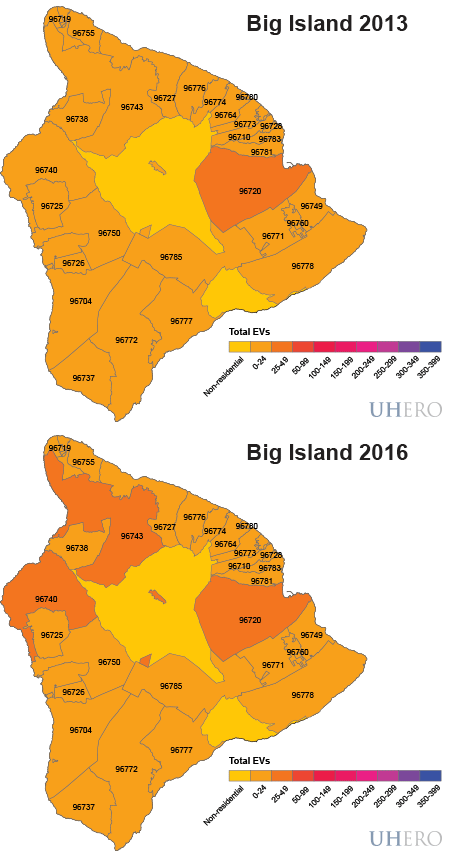

Figure 3. Tesla Adoption on Oahu, Maui and Hawaii Island
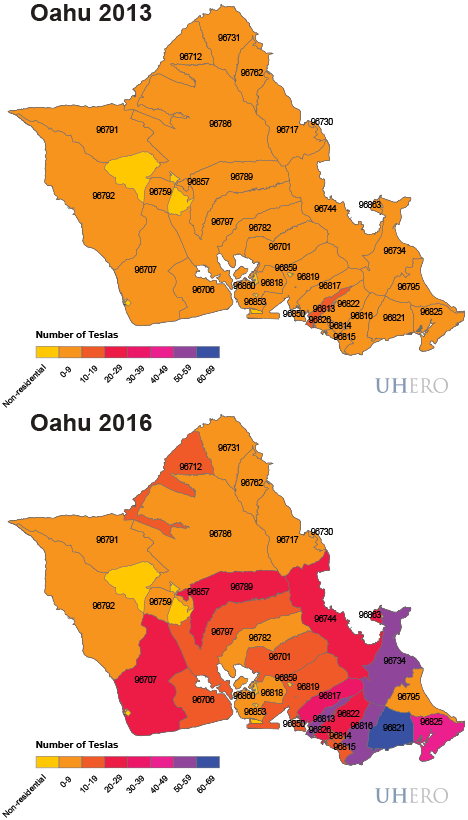

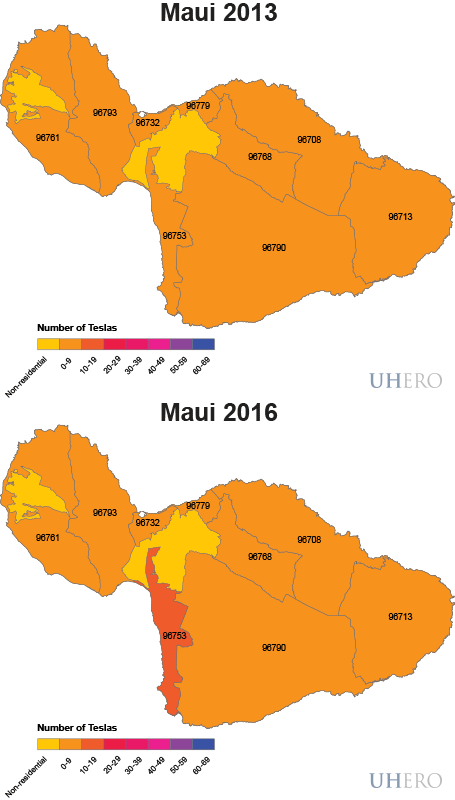

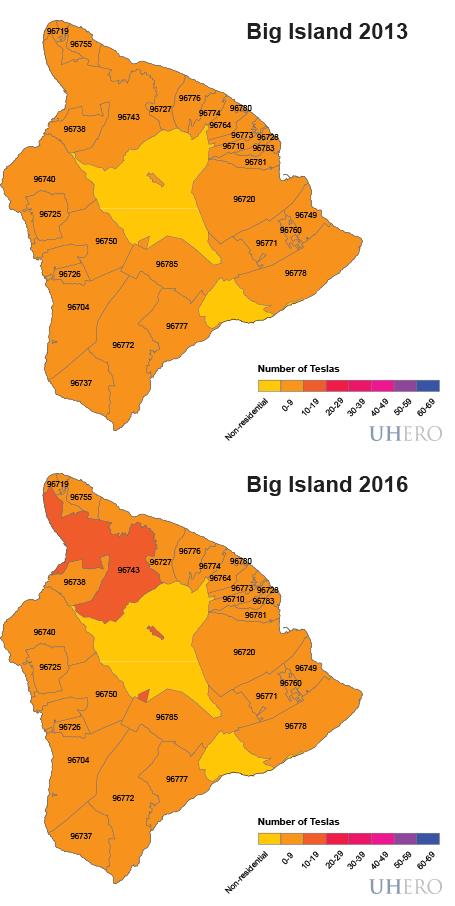

We find that geographic-based peer effects generate one additional Tesla sale for every 26 Teslas sold in a zip code. How meaningful the magnitude of these peer effects may be is likely contextual. If for example policy focused specifically on marketing to peers and social networks, this may not provide much gain. However, as a pure spillover effect, peer effects can be meaningful. If, for example, Hawaii were to offer a second round of vehicle purchase subsidies, the peer multiplier effect estimated in our analysis would increase the additional Teslas purchased by 4-5% over each year of the vehicle’s life. As a lower bound, this amounts to roughly 1 additional Tesla per zipcode as a result of peer effects. One note of caution: whether the peer multiplier for Teslas—a very high-end vehicle—will translate as the peer multiplier for other lower-priced EVs, such as the Nissan Leaf or Chevy Volt, remains an open question.
BLOG POSTS ARE PRELIMINARY MATERIALS CIRCULATED TO STIMULATE DISCUSSION AND CRITICAL COMMENT. THE VIEWS EXPRESSED ARE THOSE OF THE INDIVIDUAL AUTHORS. WHILE BLOG POSTS BENEFIT FROM ACTIVE UHERO DISCUSSION, THEY HAVE NOT UNDERGONE FORMAL ACADEMIC PEER REVIEW.
References
IHS Markit. (2016). Dataset of New Vehicle Registrations by state 2010-2015.
U.S. Census Bureau. (2010-2015). 2010-2015 American Community Survey 1-Year Population Estimates.


