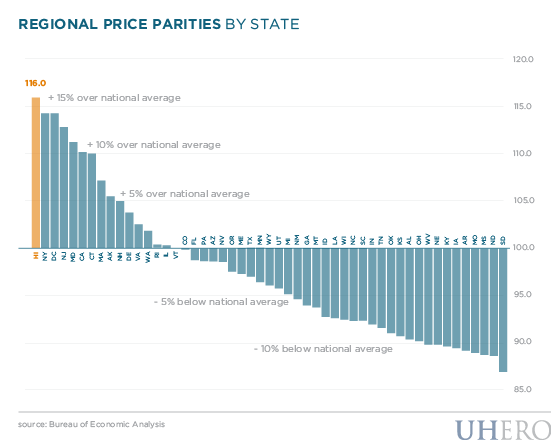
One dollar in Hawaii does not go as far as one dollar in South Dakota. Regional Price Parities (RPPs) measure differences in the price levels of goods and services across states and metropolitan areas for a given year. RPPs are expressed as a percentage of the overall national price level for each year. In 2011 Hawaii had the highest RPP in the country, 16% higher than the national average. South Dakota was 13% lower than the national average.
RPP’s allow economists to compare incomes across regions, since the same salary will have different purchasing powers in different places. The U.S. Bureau of Economic Analysis recently released new real (inflation-adjusted) estimates of personal income for states and metropolitan areas which account for these differences. Although Hawaii’s income grew faster than the national average in 2011 (3% vs. 2.7%), Hawaii’s real per-capita incomes were one of the lowest in the nation, $32.5k compared to national average of $36.5k. Hawaii ranked 45th out of the 50 states and D.C. This difference is even more pronounced on the neighbor islands, where real per-capita personal income was $29.4k (with Oahu at $33.5k).
– Kimberly Burnett
Note: these are new, experimental RPP. Please see this link.