BLOG POSTS ARE PRELIMINARY MATERIALS CIRCULATED TO STIMULATE DISCUSSION AND CRITICAL COMMENT. THE VIEWS EXPRESSED ARE THOSE OF THE INDIVIDUAL AUTHORS. WHILE BLOG POSTS BENEFIT FROM ACTIVE UHERO DISCUSSION, THEY HAVE NOT UNDERGONE FORMAL ACADEMIC PEER REVIEW.
By JoonYup Park
Migration is one of the most important forces shaping Hawai‘i’s population and economy. Yet, our understanding of who is moving in and out of the state is often limited or based on anecdote. A common narrative suggests that Hawai‘i is losing lifelong residents at an increasing pace—particularly younger generations who form the backbone of the state’s economy—while retirees move in seeking a better quality of life.
In this blog post, we shed light on how Hawai‘i’s migration patterns have changed in recent years, where people are going and coming from, and how these patterns differ by age, race, and place of birth. Using data sources from the Census Bureau, we find that the story is more nuanced than it first appears. Although domestic net-migration remains largely negative—meaning more people move out of Hawai‘i to different parts of the US—international in-migration has kept the total net-migration in balance. We also find that while many young adults do leave the state, a growing number of working-age individuals and Hawai‘i-born residents are returning.
Overall Migration Pattern
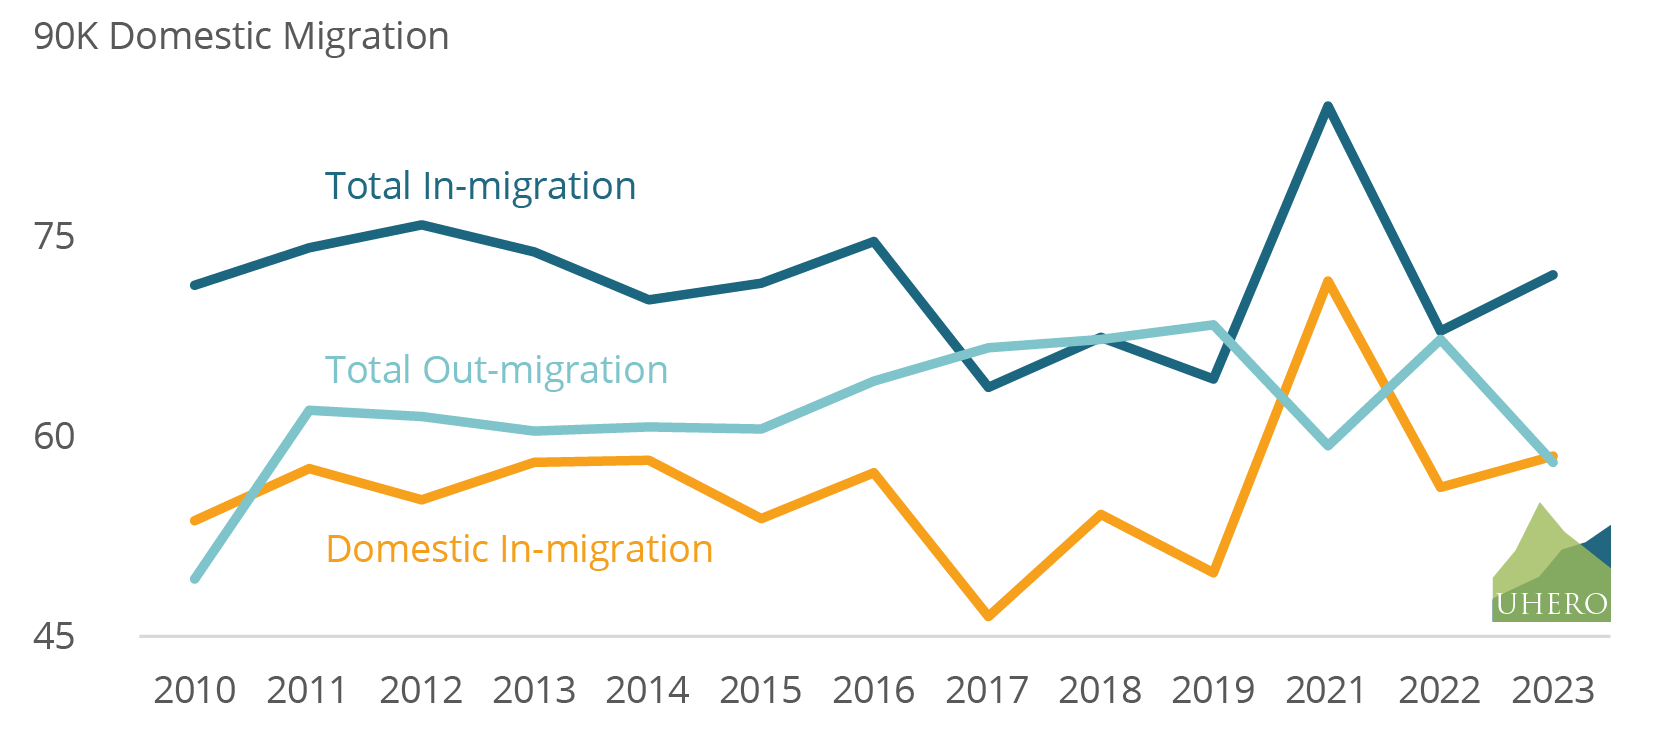
In 2023, about 72,000 individuals moved to Hawai‘i. Of these, 81%, accounting for about 58,000 people, migrated from domestic locations within the United States. At the same time, the state experienced a total out-migration of approximately 58,000 individuals, the majority of whom relocated to California, Washington, and Texas.[1] These three states accounted for 14%, 11%, and 9% of all out-migrants, respectively.
Figure 1 illustrates the in- and out-migration trend from 2010 to 2023. Notably, 2023 was the first year—excluding 2021—when the state did not experience a net population loss due to domestic migration. The 2021 exception was largely driven by an influx of remote workers taking advantage of pandemic era work-from-home flexibility, as well as those returning to be closer to family during the pandemic. However, when international migration is included, Hawai‘i has generally maintained a positive net-migration rate, meaning more people have moved to the state from both the U.S. and abroad than have left. This long-run pattern of positive total net-migration ended in 2019 with a string of four years of net out-migration, a first since statehood.
Figure 1 – Trend in In- and Out-migration of Hawai‘i from 2010 to 2023
Note: Data on 2020 is excluded due to possible distortion in migration trends caused by the COVID-19 pandemic.
Where do these domestic newcomers settle? State-to-county migration flow data from 2018 to 2022 provides insight into how migration is distributed across the islands. As expected, Honolulu County received the largest share, accounting for 76% of all in-migrants from outside the state. Hawai‘i County followed with 11%, while Maui County and Kaua’i County received 9% and 4% respectively.
Demographic Characteristics of Migrants
Who is moving to and from the Aloha State? We first focus on the racial and ethnic composition of in- and out-migrants in 2023.
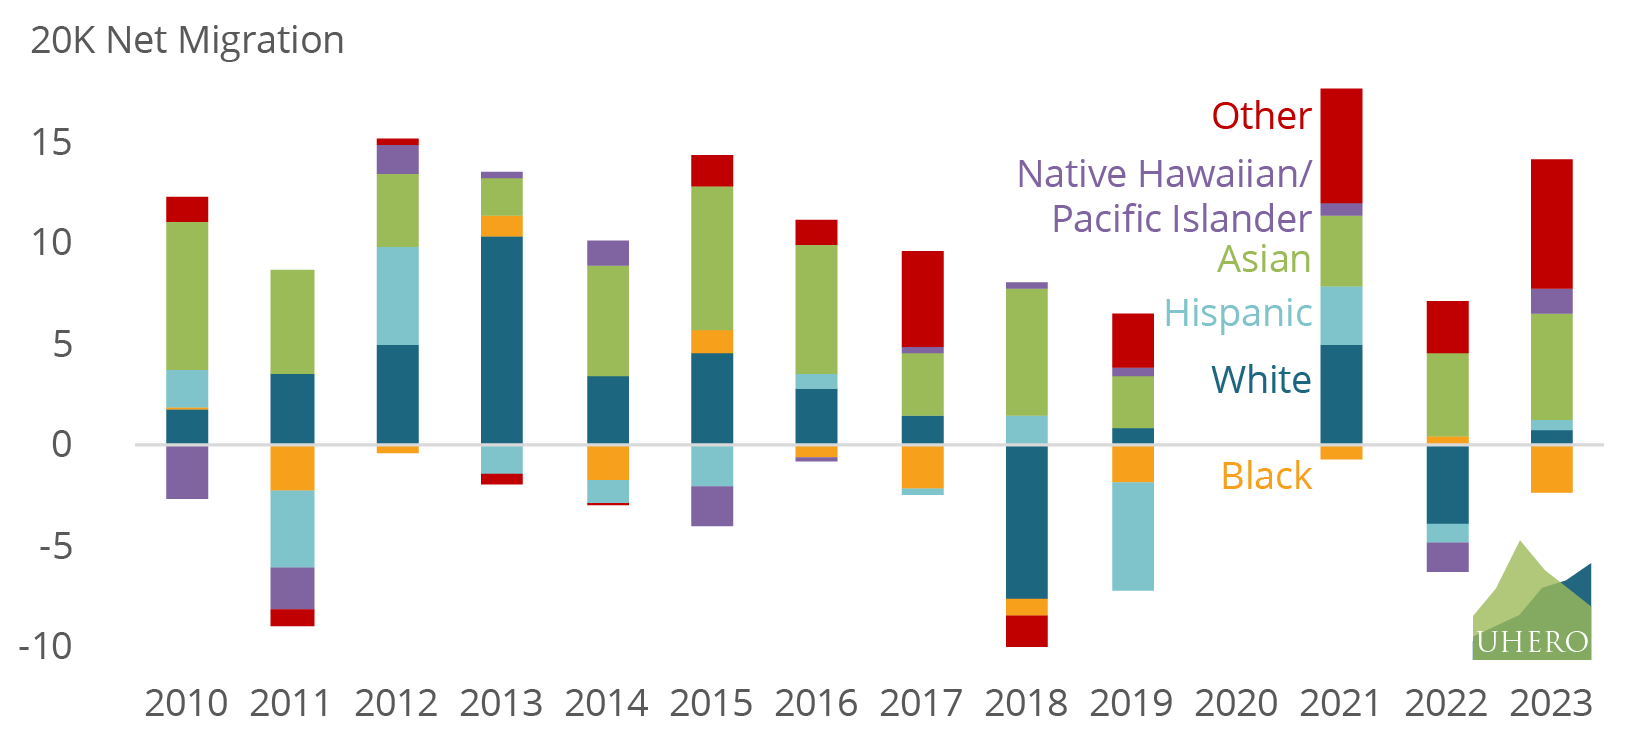
White individuals comprised the largest share of in-migrants at 45%, marking a 5 percentage point increase from 2022, yet still below the historical average. Other groups included Hispanic individuals (17%) Asian individuals (16%), and Black individuals (3%). Hispanic in-migration has risen notably from its pre-COVID historical average of 11%. Native Hawaiian and Pacific Islanders accounted for 3% of in-migrants, while an additional 16% identified as “other,” which includes individuals of two or more races.
The racial composition of the total out-migrants has remained relatively stable over time. In 2023, White individuals made up 54% of all out-migrants, while Black and Asian individuals each accounted for 9%. Native Hawaiian and Pacific Islanders represented about 1% of those leaving the state. This accounts for roughly 470 individuals which is well below the historical average from 2010, when about 1,580 individuals left the state each year. However, one key shift stands out. Hispanic out-migration has steadily increased from 11% in 2010 to 20% of total out-migrants in 2023, a trend similar to Hispanic in-migration.
Figure 2.A. shows the changing racial and ethnic characteristics of all in-migrants and out-migrants by examining the net-migration pattern for various sub-demographic groups from 2010 to 2023. Net-migrations for White and Asian individuals stayed largely positive, while the average net-migration for other racial groups remained unchanged at zero.
Figure 2.A. – Total Net-migration of Hawai‘i by Racial and Ethnic Group from 2010 to 2023
Note: Data on 2020 is excluded due to possible distortion in migration trends caused by the COVID-19 pandemic.
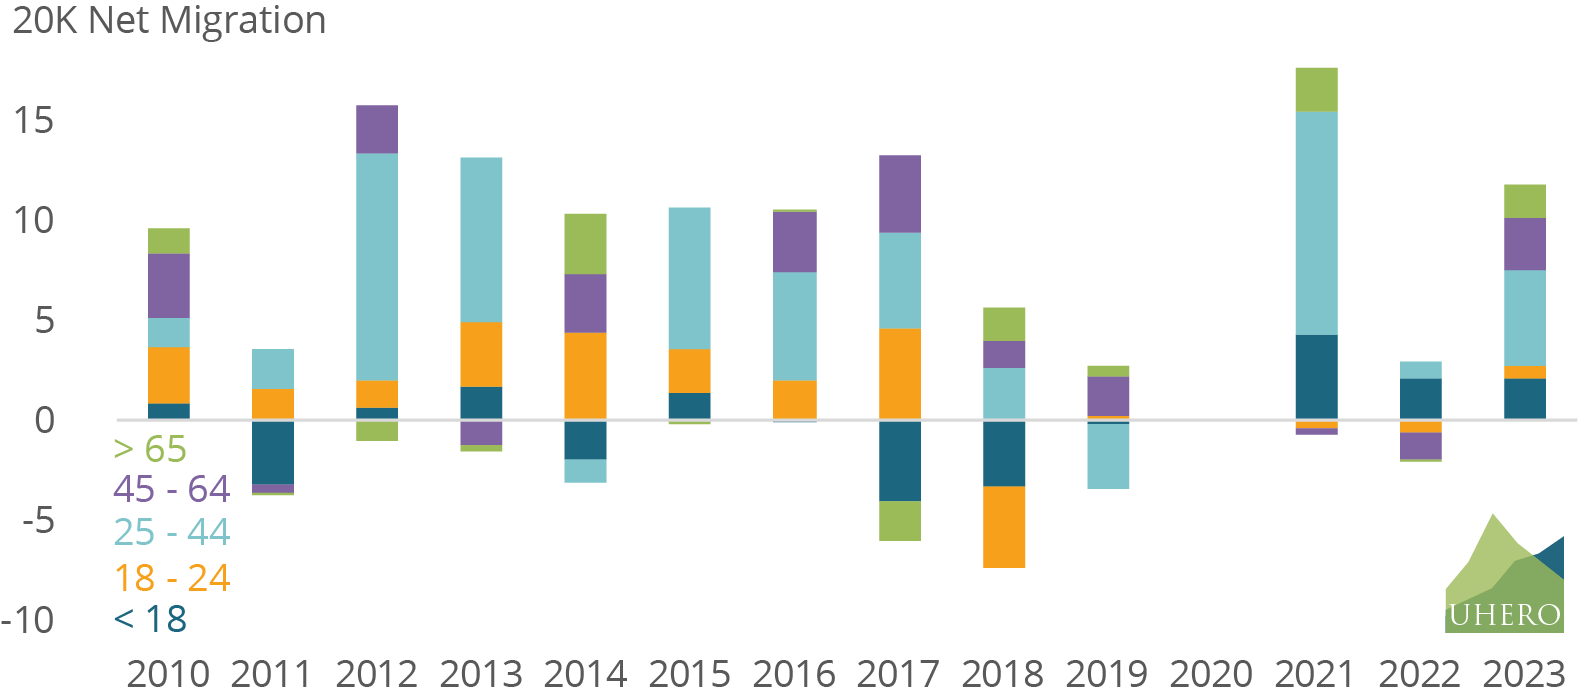
Figure 2.B. – Total Net-migration of Hawai‘i by Age Group from 2010 to 2023
Note: Data on 2020 is excluded due to possible distortion in migration trends caused by the COVID-19 pandemic.
A common misperception is that younger generations are leaving Hawai‘i in search of better job opportunities and education, while older, retired individuals move in for the climate, culture and amenities. This would have significant economic implications for the state, potentially shrinking the labor force, tax base, and overall economic growth.
However, the data tells a different story. Most of the net population gain comes from individuals aged 25 to 44—prime working-age individuals. As shown in Figure 2.B., this younger generation is driving the state’s general trend of positive net migration. While there is also a notable in-migration of individuals aged 65 and older, the idea that young adults are leaving en masse is not fully supported by the data.
Migration Pattern of Hawai‘i-Born
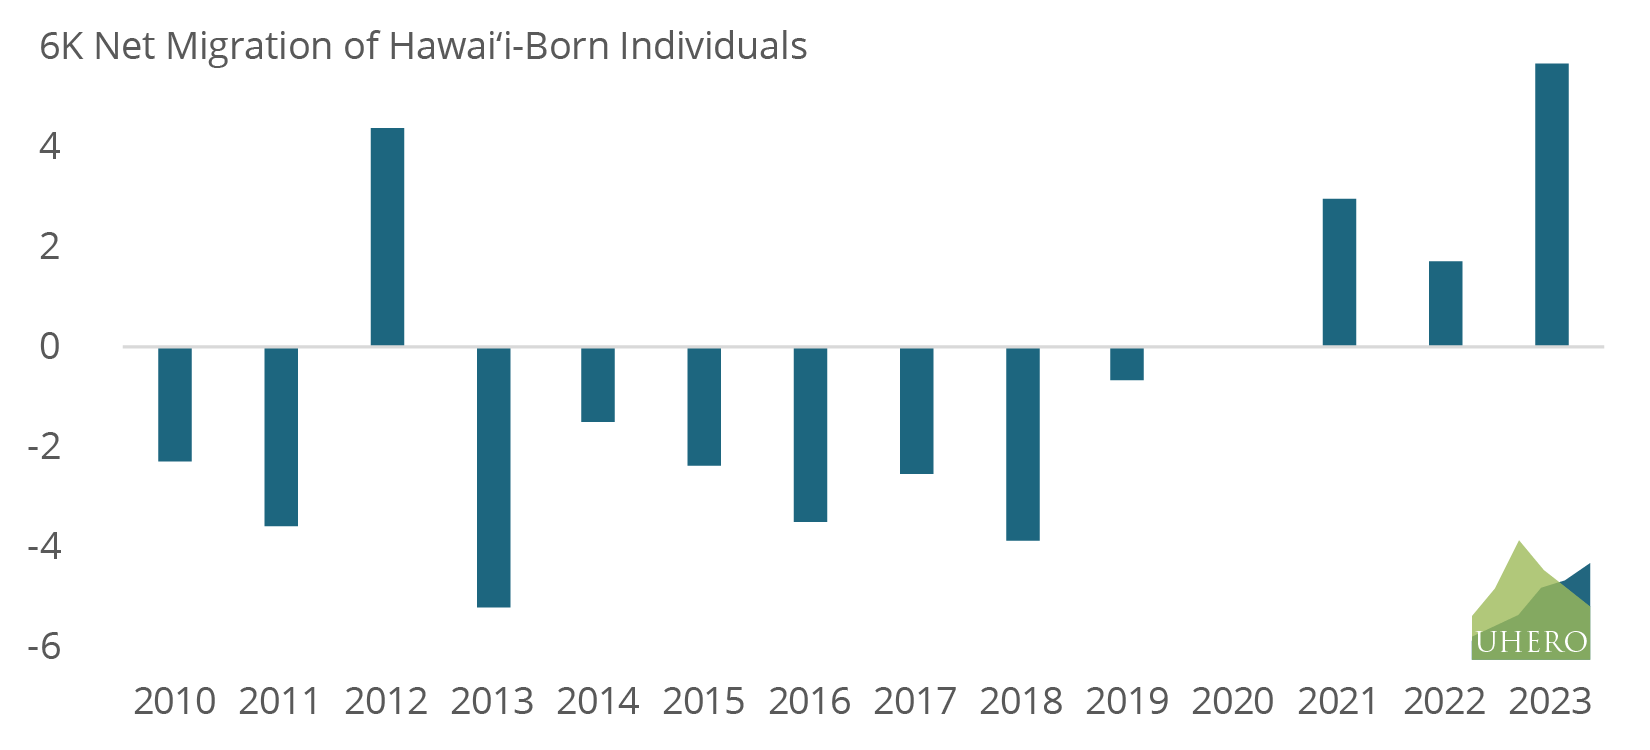
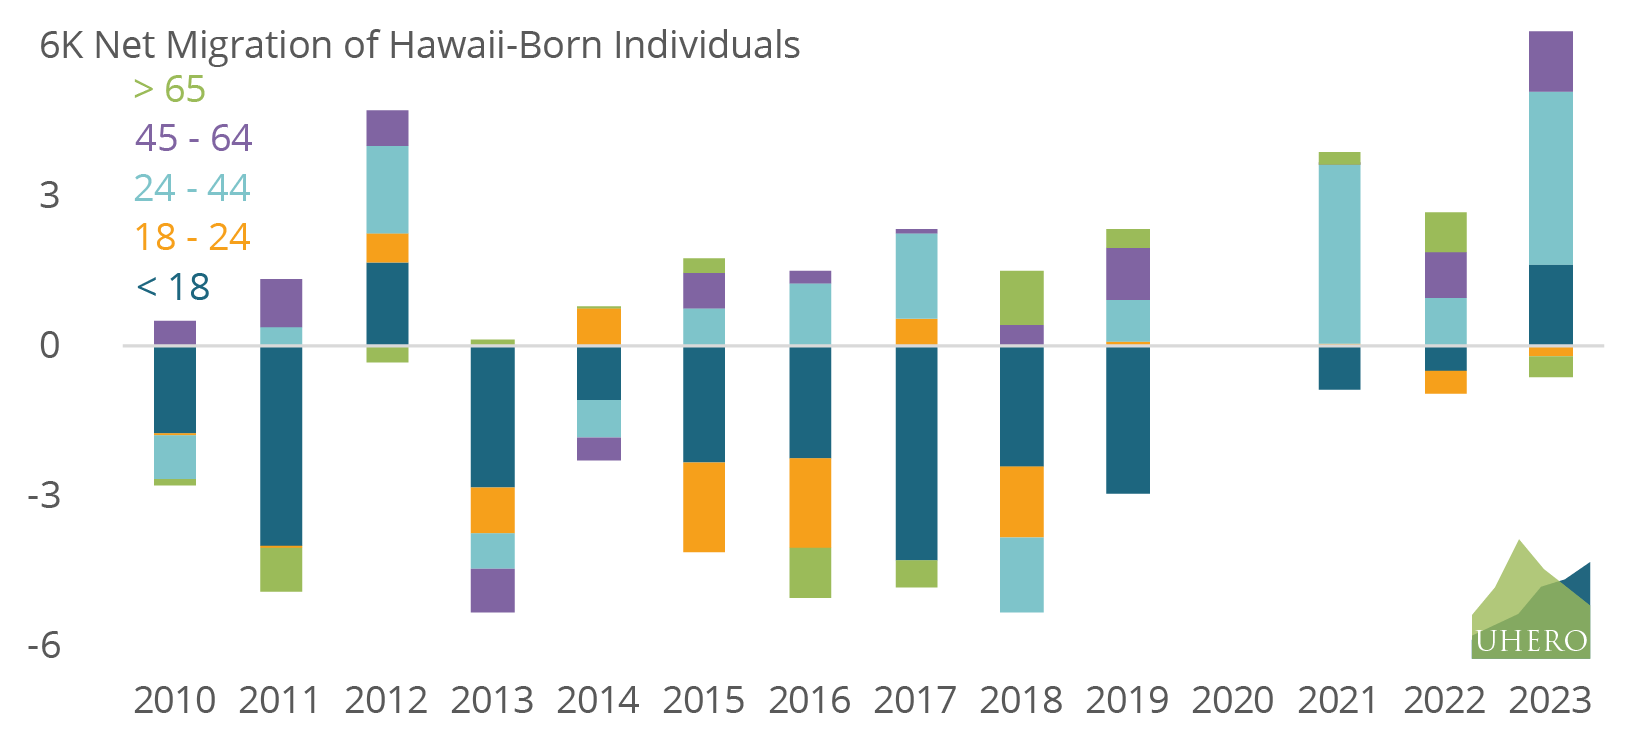
In 2023, about 12,100 Hawai‘i-born individuals moved back to the state, while approximately 6,400 moved out. This marks a reversal from pre-COVID trends, when more Hawai‘i-born residents were leaving the state than returning. As shown in Figure 3.A., this shift suggests a changing dynamic in Hawai‘i-born migration patterns after the pandemic.
Figure 3.A. – Trend in Net-migration of Hawai‘i-Born Individuals from 2010 to 2023
Note: Data on 2020 is excluded due to possible distortion in migration trends caused by the COVID-19 pandemic.
Figure 3.B. – Net-migration of Hawai‘i-Born Individuals by Age Group from 2010 to 2023
Note: Data on 2020 is excluded due to possible distortion in migration trends caused by the COVID-19 pandemic.
Age-based migration patterns indicate different trends across generations as shown in Figure 3.B. Net migration remained negative among young adults between the ages of 18 and 24, meaning more individuals in this age group left the state than moved in. Many in this group likely left for college or early career opportunities on the mainland. In contrast, the prime working-age group (25-to-44) saw a notable net migration gain. This suggests that while some leave the islands when they are younger, many may be returning later in their careers, although it is unclear from the data whether the 25-44 in-migrants are the same people who left when they were younger.
The net-migration pattern for children under 18 remained generally negative throughout, reflecting a 13% decline in enrollment in Hawai’i public schools over the past 20 years. Lastly, net-migration of people older than 65 remained unchanged at zero over time, suggesting that an inflow of retired individuals has been similar to the outflow.
Conclusion
Hawai‘i’s migration patterns reveal a more balanced picture than what common narratives suggest. While domestic out-migration, particularly among young adults, continues, international migration and the return of working-age individuals have played an important role in stabilizing the population. Recently, Hawai’i-born individuals have also contributed to this in-migration trend. Understanding these patterns is essential for developing informed housing, labor, and economic policies.
Disclaimer on Data Limitations
Migration estimates presented in this report are based on various data products from the Census Bureau and are subject to large margins of error. This is especially true for Hawai‘i, where sample sizes are smaller than in larger states. This limitation highlights the need for careful interpretation of numbers and trends, particularly for smaller sub-groups within the population.
In addition, recent population estimates have been affected by updated Census methodology for measuring international net migration. The methodological changes resulted in an increase in the estimated national population change between 2021 and 2024 by more than 3.3 million people, with most of the adjustment attributed to higher counts of humanitarian migrants, such as those admitted through the U.S. Refugee Admissions Program or identified by the Office of Homeland Security Statistics.
After adjusting the national population estimates, the national total population estimates are distributed down to the states and counties based on estimates of the demographic composition of the migrants and the state characteristics. However, it remains unclear whether Hawai‘i is actually experiencing a meaningful increase in international net migration made up primarily of humanitarian arrivals. Even if Hawai‘i’s population counts did not increase over the past two years due to these changes, such inflows are unlikely to continue over time.
1 We abstract away from discussing international out-migrants from Hawai‘i, as they make up only a small fraction of total out-migration. Based on county-to-county migration data from the 5-year American Community Survey (from 2007-2011 to 2016-2020), international out-migrants accounted for an average of approximately 0.08% of all individuals leaving the state. As such, we refer to domestic out-migration as total out-migration throughout this post.