BLOG POSTS ARE PRELIMINARY MATERIALS CIRCULATED TO STIMULATE DISCUSSION AND CRITICAL COMMENT. THE VIEWS EXPRESSED ARE THOSE OF THE INDIVIDUAL AUTHORS. WHILE BLOG POSTS BENEFIT FROM ACTIVE UHERO DISCUSSION, THEY HAVE NOT UNDERGONE FORMAL ACADEMIC PEER REVIEW.
By Byron Gangnes
Stock prices are at a very high level, and yet investors have not pulled back. What gives? How should we think about stock market values?
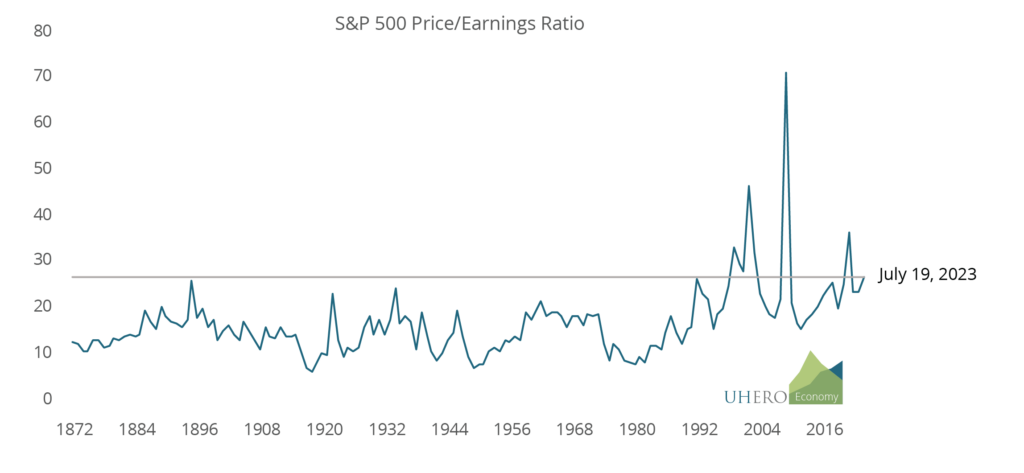
In the long run, the price of a share of common stock should depend on the expected future stream of company earnings. Even growth stocks—which tend to pay little or no dividend—should follow this rule, since any appreciation in stock value should also be driven by expected earnings growth. A commonly reported measure of stock value is the price/earnings (PE) ratio, which for the S&P 500 stock index was above 26 on July 19, much higher than its average of roughly 16 since 1872. [1]
A major challenge of course is to know what measure to use as an estimate of expected future earnings. The PE ratio above uses the latest reported earnings, which may be affected by a number of factors, importantly the stage of the business cycle. One partial solution is to use average earnings for a much longer historical period. Robert Shiller introduced the idea of a cyclically adjusted price/earnings ratio (CAPE) that uses average inflation-adjusted earnings from the previous 10 years. Here’s what that looks like:
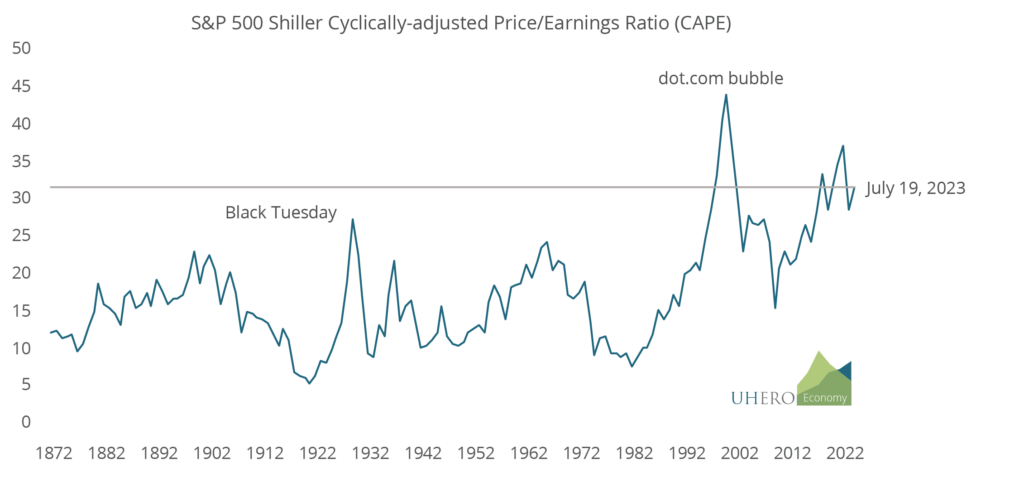
On July 19, that stood at nearly 32. While not as high as it was prior to the COVID-19 epidemic, it suggests stocks are higher relative to earnings than they have been in nearly every year since 1872. Even higher than they were before the Black Tuesday stock market crash of 1929.
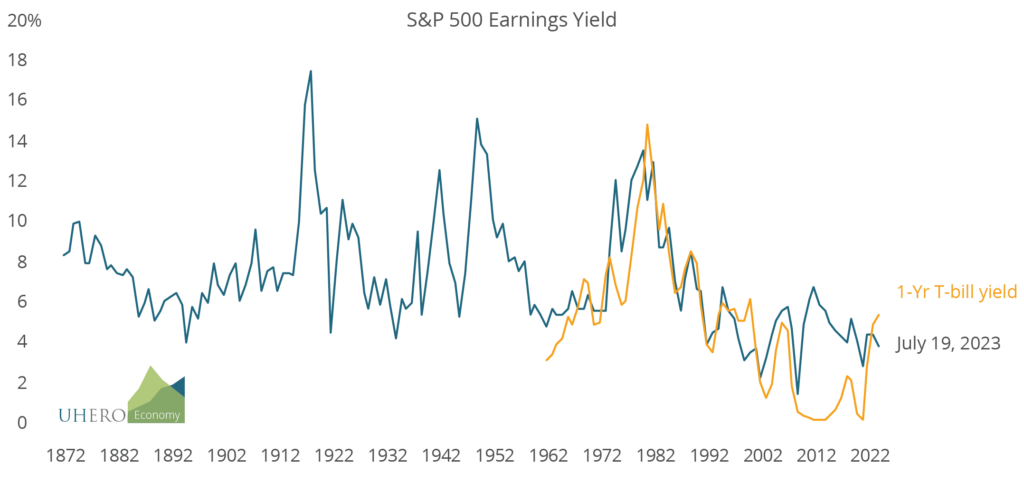
A very high PE ratio implies very low earnings per share. When interest rates were rock-bottom low, stock earnings looked very attractive. But now safe US government bonds are paying a lot more than before. On July 19, the one-year fixed maturity US Treasury bill was paying 5.3%, compared with an earnings yield of just 3.8% on the S&P 500. This makes it even harder to understand why an investor would prefer risky stock investments at this time.
So aggregate PE measures suggest that overall stock prices at least for the S&P 500 may be overvalued or very overvalued by historical standards.
Is there a way that these prices may nevertheless be reasonable? Sure. One possibility is that backward ten-year average earnings are a poor proxy for expected earnings now. For example, stock prices often (but not always) begin to turn up before a recession or a period of slow growth has ended, because of optimism that the economic (and therefore revenue) outlook has improved, justifying a higher stock price.
In addition, there may be unusual factors at work that justify a high earnings outlook. For example, the recent emergence of generative artificial intelligence (AI) may create expectations of significant value growth for related companies. For example, Goldman Sachs has estimated that AI could boost productivity by as much as 1.5 percentage points annually over the next ten years, raising S&P 500 profits by 30%. And in fact, five tech companies (Apple, Microsoft, Alphabet, Amazon, and Nvidia) have accounted for most of the stock index appreciation this year.
Of course, the dot-com bubble of the late 1990s reminds us that investors can get excessively optimistic about how much technological progress will boost company prospects. The tech-heavy NASDAQ soared about 800% between 1995 and 2000, only to give up virtually all those gains by 2002. I think it is fair to say that no one knows how much of the current AI hype will turn out to be justified in the long run.
There are other reasons that individual investors might stay invested in stocks despite their current high prices relative to earnings. Since bond prices tend to be inversely related to interest rates, bonds could face capital losses if there are further interest rate hikes. Many investors are in it for the long haul and will tolerate stock market declines in order to take advantage of potential gains. And, of course, these PE ratios are averages across many stocks, so even with high overall valuations, specific stocks will still be attractive.
Evaluating stock prices and especially their future paths is extraordinarily difficult. But PE ratios provide one signal about current stock market values. Right now, that signal is flashing bright red.
1 The PE ratios, earnings yield, and inflation-adjusted stock price index are taken from www.multpl.com.