BLOG POSTS ARE PRELIMINARY MATERIALS CIRCULATED TO STIMULATE DISCUSSION AND CRITICAL COMMENT. THE VIEWS EXPRESSED ARE THOSE OF THE INDIVIDUAL AUTHORS. WHILE BLOG POSTS BENEFIT FROM ACTIVE UHERO DISCUSSION, THEY HAVE NOT UNDERGONE FORMAL ACADEMIC PEER REVIEW.
By Carl Bonham and Peter Fuleky
When the long-lived expansion of the past decade was interrupted by the COVID-19 pandemic, many economists turned their attention to new sources of data to track economic conditions. The indicators we have used historically were not timely enough in the quickly changing economic landscape. Take for example gross domestic product (GDP), the oft cited measure of aggregate economic activity. The advance estimate of US GDP is released about one month after the end of the reference quarter, and the preliminary estimate of Hawaii GDP is released with a three-month lag (this already reflects a recently implemented acceleration of state-level GDP releases). In early October, we learned that Hawaii real GDP declined at a 42% annual rate in the second quarter. And at the end of December we will find out how much of a rebound occurred during the summer. Thus, changes in state GDP clearly cannot be used to inform decision making in real time.
Despite its long release lag (and its tendency to neglect natural resources, environmental costs, and the distributional aspects of economic growth), GDP is still an important indicator of overall economic conditions. It is the result of a complex and systematic effort to measure all economic activity. As such, it is based on accounting principles rather than statistical models, but the latter are used to fill gaps if some underlying data is not available at the time of the early releases. GDP gets revised multiple times as more information becomes available about the covered period, and there is a benchmark revision every five years based on an economic census covering all businesses.
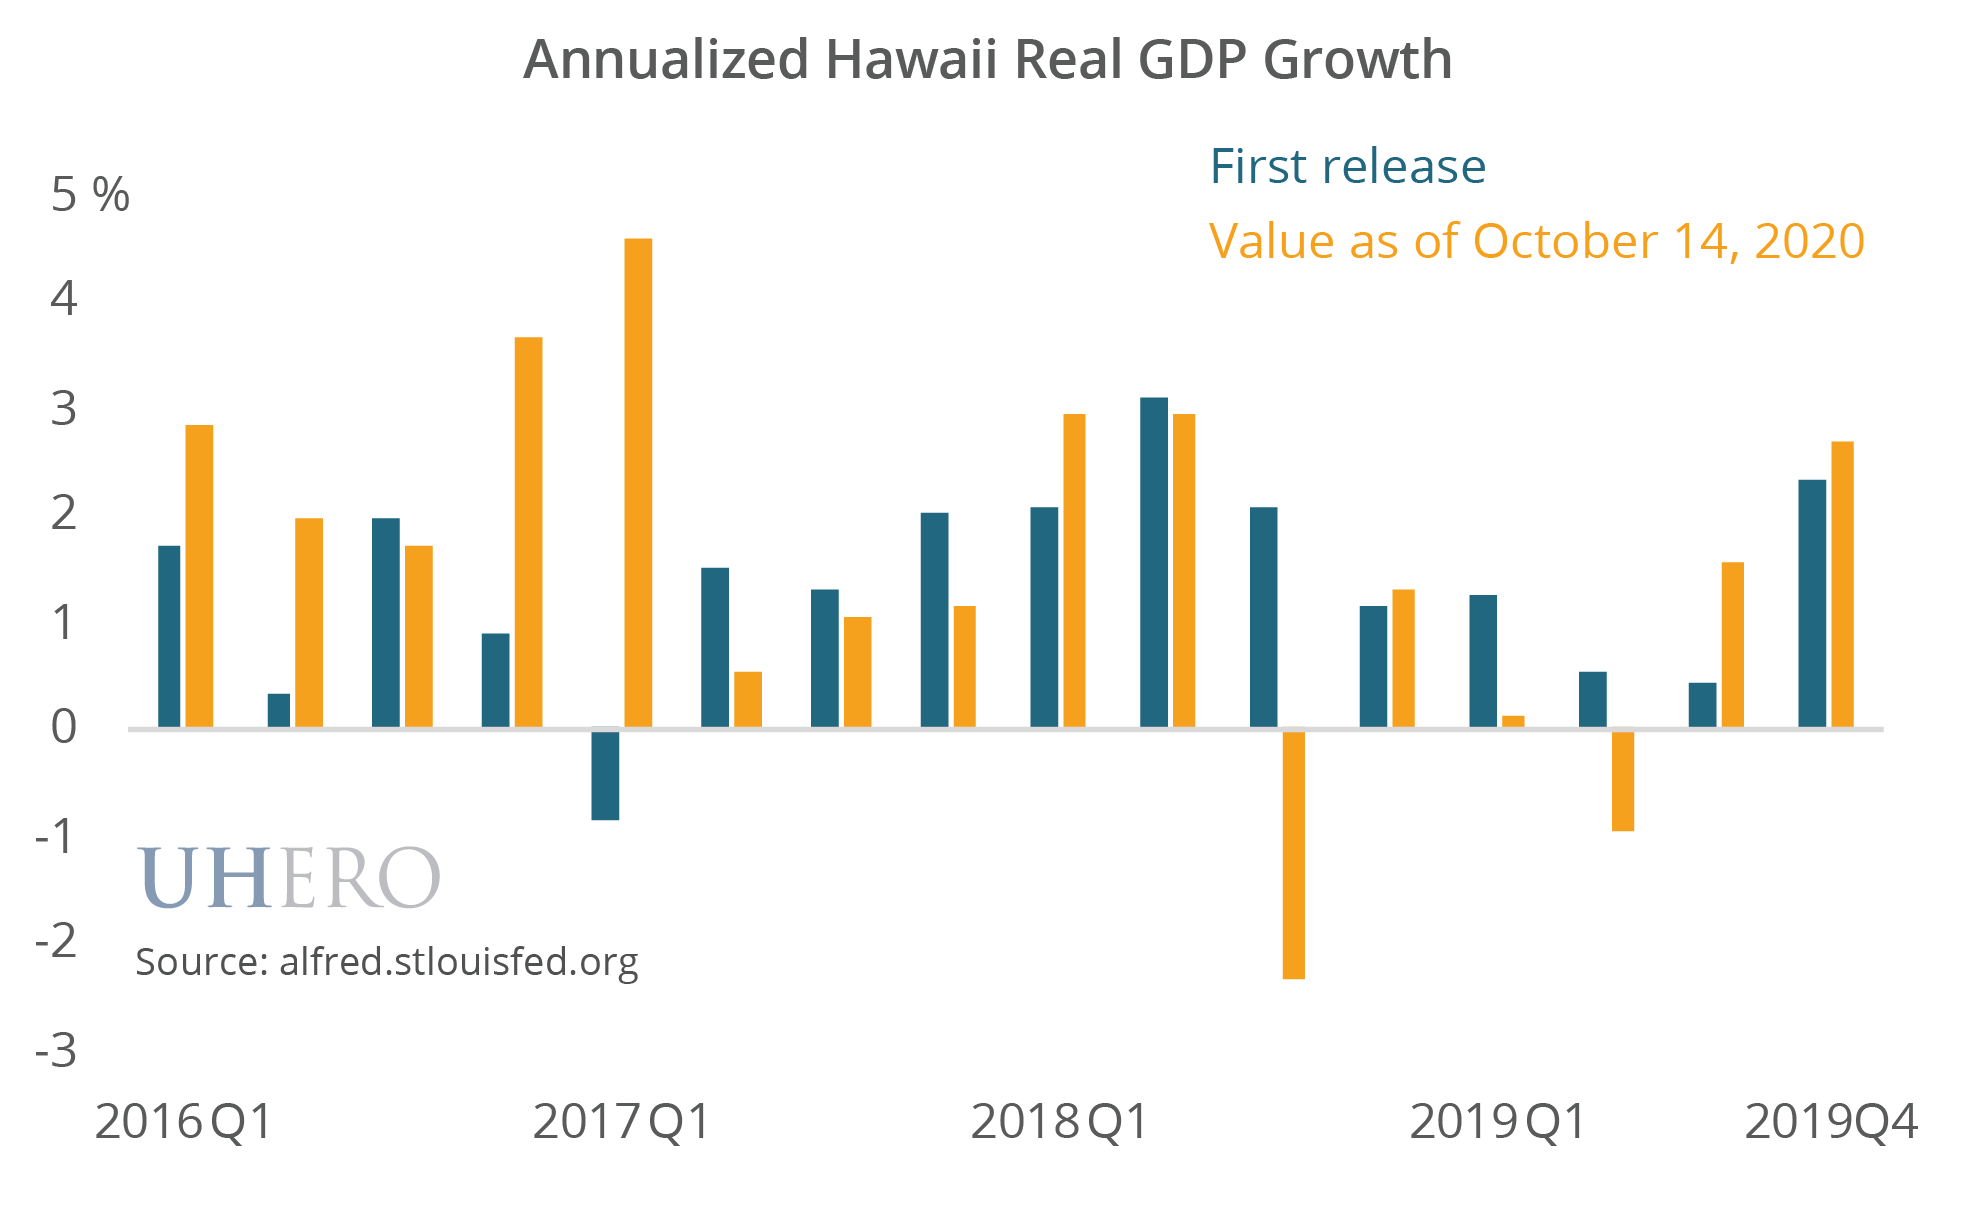
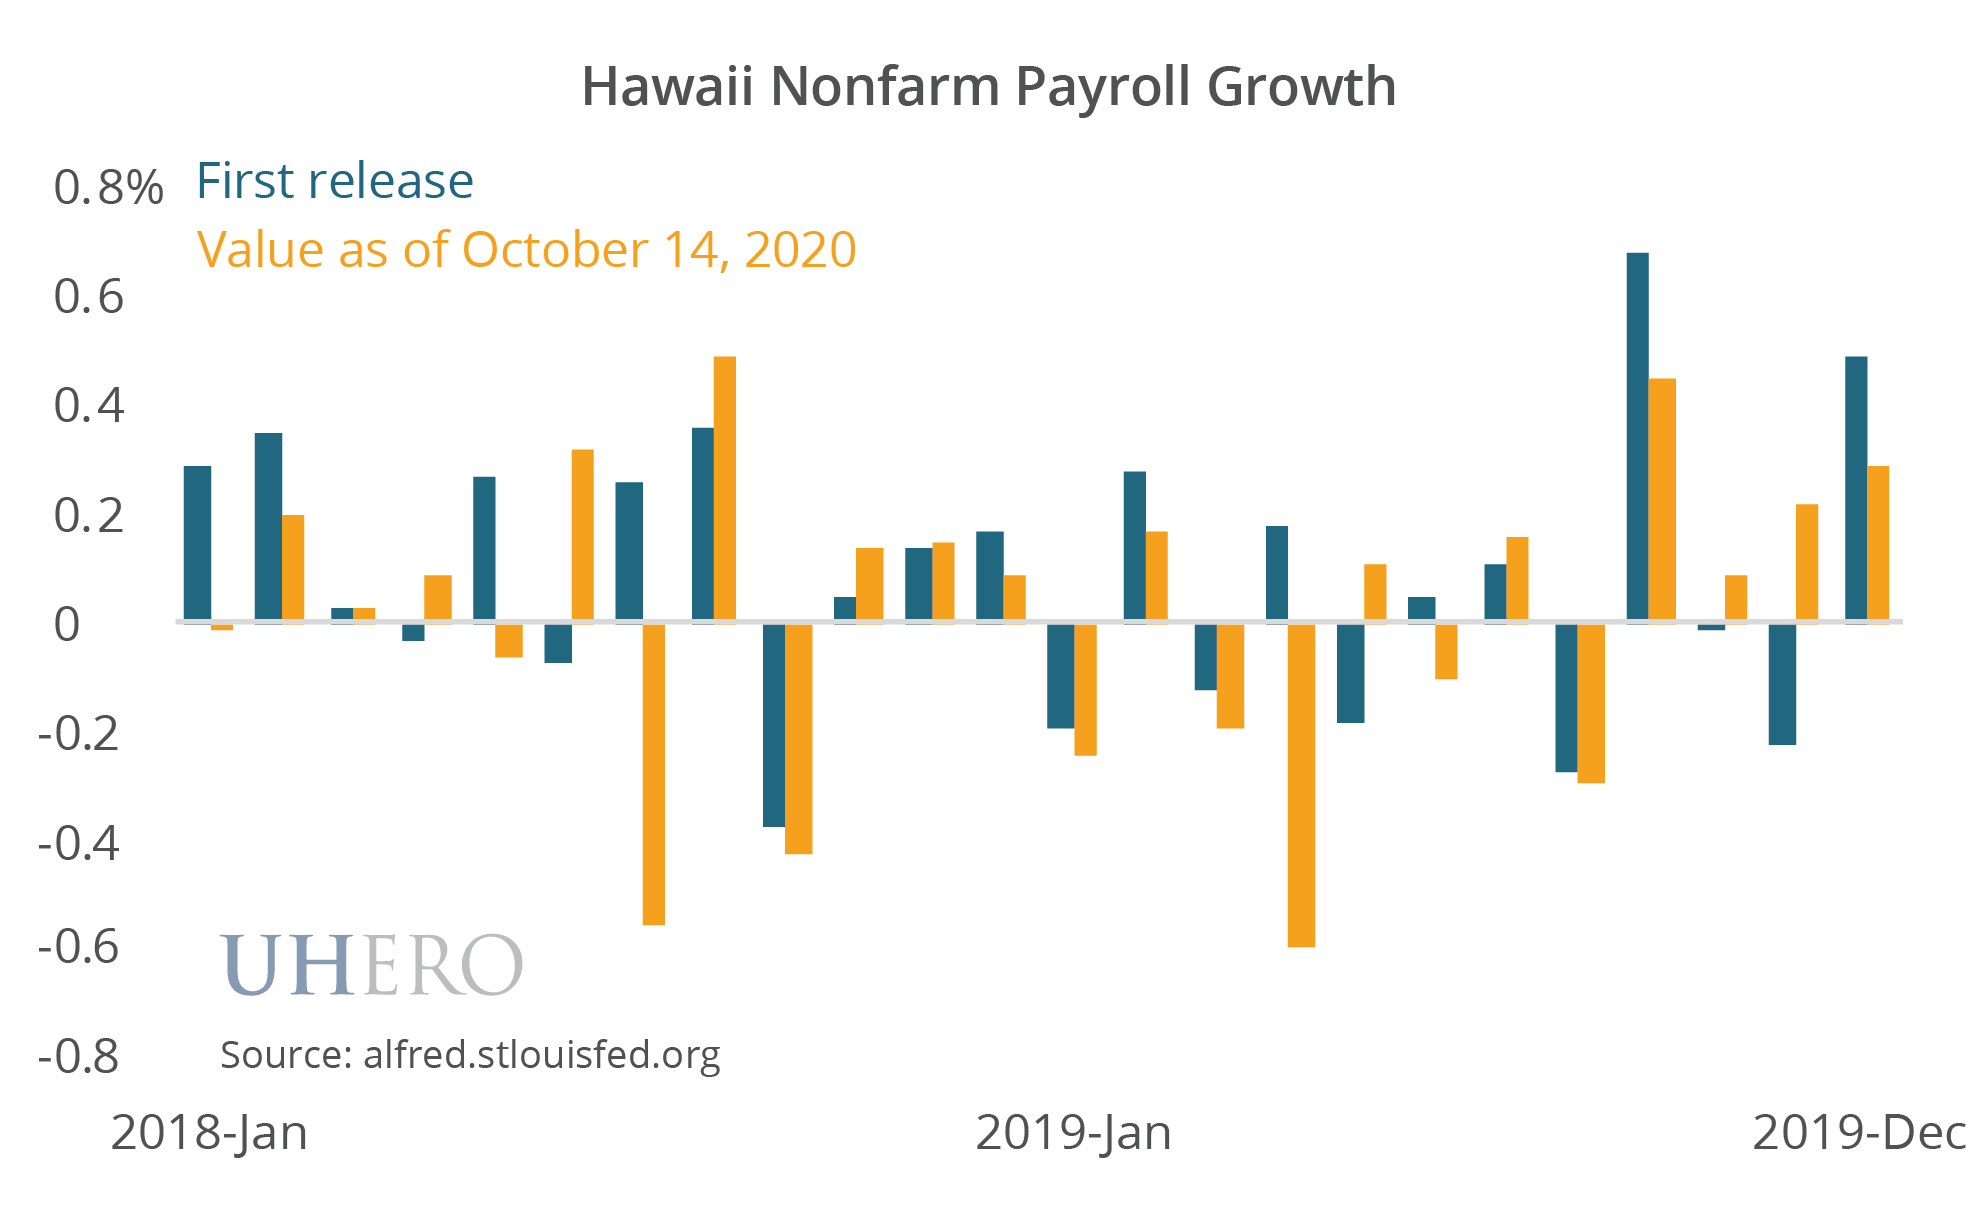
The “relatively quick” initial release and subsequent revisions highlight the tradeoff between the timeliness and accuracy of an indicator. GDP is not the only measure of economic activity that goes through this process—payrolls, personal income, and visitor spending and arrivals—are also revised after their initial release. Moreover, with large structural changes in economic relationships and shutdowns impeding data collection, initial estimates may undergo large revisions. Yet, in the wake of the COVID-19 outbreak, timeliness became paramount given the need to quickly estimate changing conditions on the ground.
Think about it this way: you have to know where you are before you can try to predict where you will be in a day or a week. Imagine the 11PM forecast from the Central Pacific Hurricane Center stating that a storm was located 500 nautical miles east of Hilo, traveling west at 10 knots. Then the next morning at 9AM they find out that the satellite data and the data from hurricane hunters was off by 350 miles so the hurricane is now only 5 hours from landfall. Unfortunately economic data, and most data in the social sciences, is not measured by satellites and by direct observation; it is survey based. With lack of contemporaneous data and use of incomplete survey samples to be revised multiple times, the first challenge is to figure out where the starting point is.
As a case in point, when we were trying to nail down how bad the job losses might be at the very beginning of the tourism and local economy shutdowns in late March and early April. We had preliminary data for job counts by industry for February, but no data at all for March or April. So we relied on the incoming data on the number of initial unemployment claims, and data from quick surveys that we put together with the Chamber of Commerce. But later it turned out that more than one third of the applications for unemployment insurance claims were invalid, either fraudulent, duplicates or for other reasons. So the incoming data led us to overestimate the number of lost jobs in April. In fact, a comparison of initial claims with layoffs exposes discrepancies that caution against relying too much on any individual series.
In addition to using data released by government agencies, we began incorporating data from private sources into our forecasts. Private data usually reflects a firm’s ongoing business activities. In fact, data sharing with the public is usually outside the firm’s core business model. Private data frequently comes in relatively raw form with missing data points, it is typically not revised, and in contrast to carefully designed public surveys, there is no guarantee that later data points are compatible with earlier ones since the sample size and composition are determined by the clients of the firm at any given time. But if the private data is available at a high frequency and with a short release lag, the benefit of timely information may offset the drawbacks listed above. As illustrated by the weekly UHERO Economic Pulse index and the underlying series on the UHERO Data Portal, both data collected by government agencies and firm-specific data are useful for estimating the economic conditions in the state.
The UHERO Economic Pulse is an experimental measure of economic conditions. It summarizes information from a variety of indicators, whose number may change as more data sources become available. The index is currently based on “hard” data available at a weekly frequency, such as unemployment insurance claims and airline passenger counts. “Soft” data, such as surveys about individuals’ expectations to be laid off or willingness to travel, are potentially also useful indicators of economic conditions, and we will explore ways to incorporate such information in the index. The index appears to predict changes in Hawaii nonfarm payrolls, and we will continue to analyze its usefulness, particularly for predicting the overall economy once GDP for the third quarter is released in December.