


By Jonathan Page and Timothy Halliday
Thomas Piketty’s best-selling tome on the evolution of inequality in the US, Capital in the Twenty-First Century, has inspired us to ask—how does the distribution of income in Hawaii compare with that in the country as whole? And how has that distribution changed over time? To answer these questions, we construct an extended time series of data on income distribution and measures of income inequality for Hawaii. Using tax data from the Internal Revenue Service (IRS) and the State of Hawaii Department of Taxation (HIDOT), we compare various measures of inequality in the US and Hawaii.*
Income Share by Income Class
Here we use the labels used by Piketty to describe various groups in the income distribution. The “Dominant Class” is made up of the top one percent of families; the “Well-To-Do Class” is the group of the nine percent of families below the “Dominant Class”. The next 40 percent is called the “Middle Class” and the remaining 50 percent the “Lower Class.”

Looking at the IRS and HIDOT data,** we can see the share of income going to the “Dominant Class” increases while the share going to the “Lower Class” decreases steadily from the mid 1950s up to the present for both the US and Hawaii. However, we also see that the income distribution in recent years is more compressed in Hawaii than the US.
Let’s focus in on each of these classes one at a time to more cleanly compare the pattern of inequality in Hawaii to that in the US as a whole.
The share of income claimed by the top one percent has been lower for Hawaii than for the US overall since the early 1980s. Up until the mid 1990s the share of income claimed by the bottom 50 percent in Hawaii lagged behind the share claimed by the bottom 50 percent in the US overall.
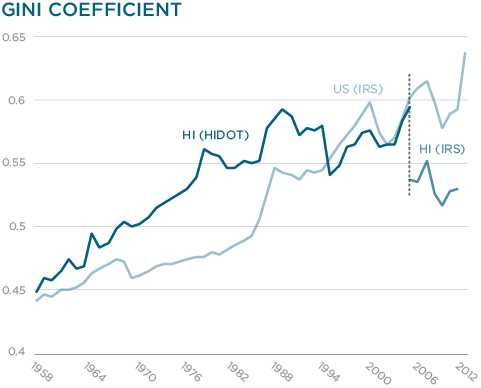
The Gini coefficient is one measure of the distance between a perfectly equal distribution of income and the actual distribution of income. A Gini coefficient of zero represents a perfectly equal society while a coefficient of one occurs when one individual claims all the income and everyone else claims none. Since the mid 1950s, the Gini coefficient has steadily increased from 0.43 to around 0.60 for both Hawaii and the US as a whole.
Income Mobility
One important caveat in this analysis is the importance of mobility. If those who were in the “Lower Class” last year are in the “Well-To-Do Class” this year, inequality is merely temporary. Unfortunately, recent research on inequality in the US and various Northern European countries suggests that greater inequality of incomes in the present leads to reduced intergenerational mobility in the future (Corak, 2013).
The Equality of Opportunity Project hones in on this issue of income mobility and the New York Times produced an interactive map for exploring the data. From this we can see that a child raised in Honolulu whose family income was in the bottom 20% had a 10.1% chance of reaching the top 20% of family income in adulthood.
Forces Behind Distributional Changes
One important finding in our analysis is that, since the mid-nineties, the share of income going to the top 1% is lower and the share going to the bottom 50% is higher in Hawaii than in the US. The fact of the matter is, economists don’t fully understand all of the causes of inequality, and a full analysis of the causes for Hawaii is well beyond the scope of this blog post. We can, however, speculate on potential causes based on the rapidly growing research on inequality.
First, higher levels of unionization in Hawaii may be protecting wages in the bottom of the distribution. In addition, recent evidence from Autor, Dorn and Hanson (2013) has shown that China’s entry into the WTO has severely hit wages of low skilled workers in the US, so the absence of a large manufacturing sector in Hawaii may be responsible for the higher income shares in the bottom half of the distribution in Hawaii vis-à-vis the US mainland.
The top 1% is not as well understood. Some such as Piketty have speculated the higher top income shares are the consequence of increased rent seeking (i.e., the top 1% increase their slice of the pie, while not increasing the size of the pie overall), while others have opined that the returns to innovation and highly skilled labor have increased for poorly understood reasons. Many such as Joseph Stiglitz and Michael Roberts in an earlier post have pointed out that Hawaii’s economy has many uncompetitive industries such as electricity production and shipping. However, this would suggest higher top income shares than elsewhere, not lower. Another possibility could be that the industrial composition of Hawaii excludes much of finance, technology and biotech. This suggests that a relative lack of highly specialized professionals in Hawaii may be responsible.
BLOG POSTS ARE PRELIMINARY MATERIALS CIRCULATED TO STIMULATE DISCUSSION AND CRITICAL COMMENT. THE VIEWS EXPRESSED ARE THOSE OF THE INDIVIDUAL AUTHORS. WHILE BLOG POSTS BENEFIT FROM ACTIVE UHERO DISCUSSION, THEY HAVE NOT UNDERGONE FORMAL ACADEMIC PEER REVIEW.
*Both the IRS and HIDOT report the number of returns by adjusted gross income (AGI) group (e.g., less than $1,000; $5,000 to $10,000; etc.). The total AGI reported for each group of returns can then be used to construct the proportion of total income a given group of families can claim (we use the total AGI reported instead of the income component from the national accounts). Income brackets reported by the tax agencies do not perfectly align with the percentage groups used by Piketty. For example, in 2005 those returns with AGI below $50,000 comprised 72.85% of all returns in Hawaii. To overcome this issue, we follow the procedure in Piketty and Saez (2003) to estimate incomes at the top of the income distribution.
**HIDOT data covers 1958-2005, IRS data are used for 2006-2011.
References:
Autor, D. H.; Dorn, D. & Hanson, G. H. 2013. “The China Syndrome: Local Labor Market Effects of Import Competition in the United States,” American Economic Review, 103(6), 2121-68.
Corak, M. 2013. “Income Inequality, Equality of Opportunity, and Intergenerational Mobility,” Journal of Economic Perspectives 27, 79-102.
Piketty, T. & Saez, E. 2003. “Income Inequality in the United States, 1913-1998.” Quarterly Journal of Economics 118 (February), 1 – 39.