BLOG POSTS ARE PRELIMINARY MATERIALS CIRCULATED TO STIMULATE DISCUSSION AND CRITICAL COMMENT. THE VIEWS EXPRESSED ARE THOSE OF THE INDIVIDUAL AUTHORS. WHILE BLOG POSTS BENEFIT FROM ACTIVE UHERO DISCUSSION, THEY HAVE NOT UNDERGONE FORMAL ACADEMIC PEER REVIEW.
By Byron Gangnes
The Fed’s war on inflation has been underway for more than a year. Interest rates have been driven up sharply, with consequences for the macroeconomic outlook—will the economy just slow or drop into a steep recession—but also for households and businesses right now. Many families have been priced out of the housing market or had to postpone buying a needed car. Small businesses are having a much harder time accessing credit even at relatively high interest rates.
Whether the Fed is done raising rates, or might even begin to cut them later this year, depends on the prospects for inflation. The good news is that inflation has been slowing. But how fast it will continue to fall is less clear. And the prospects depend a lot on where you look.
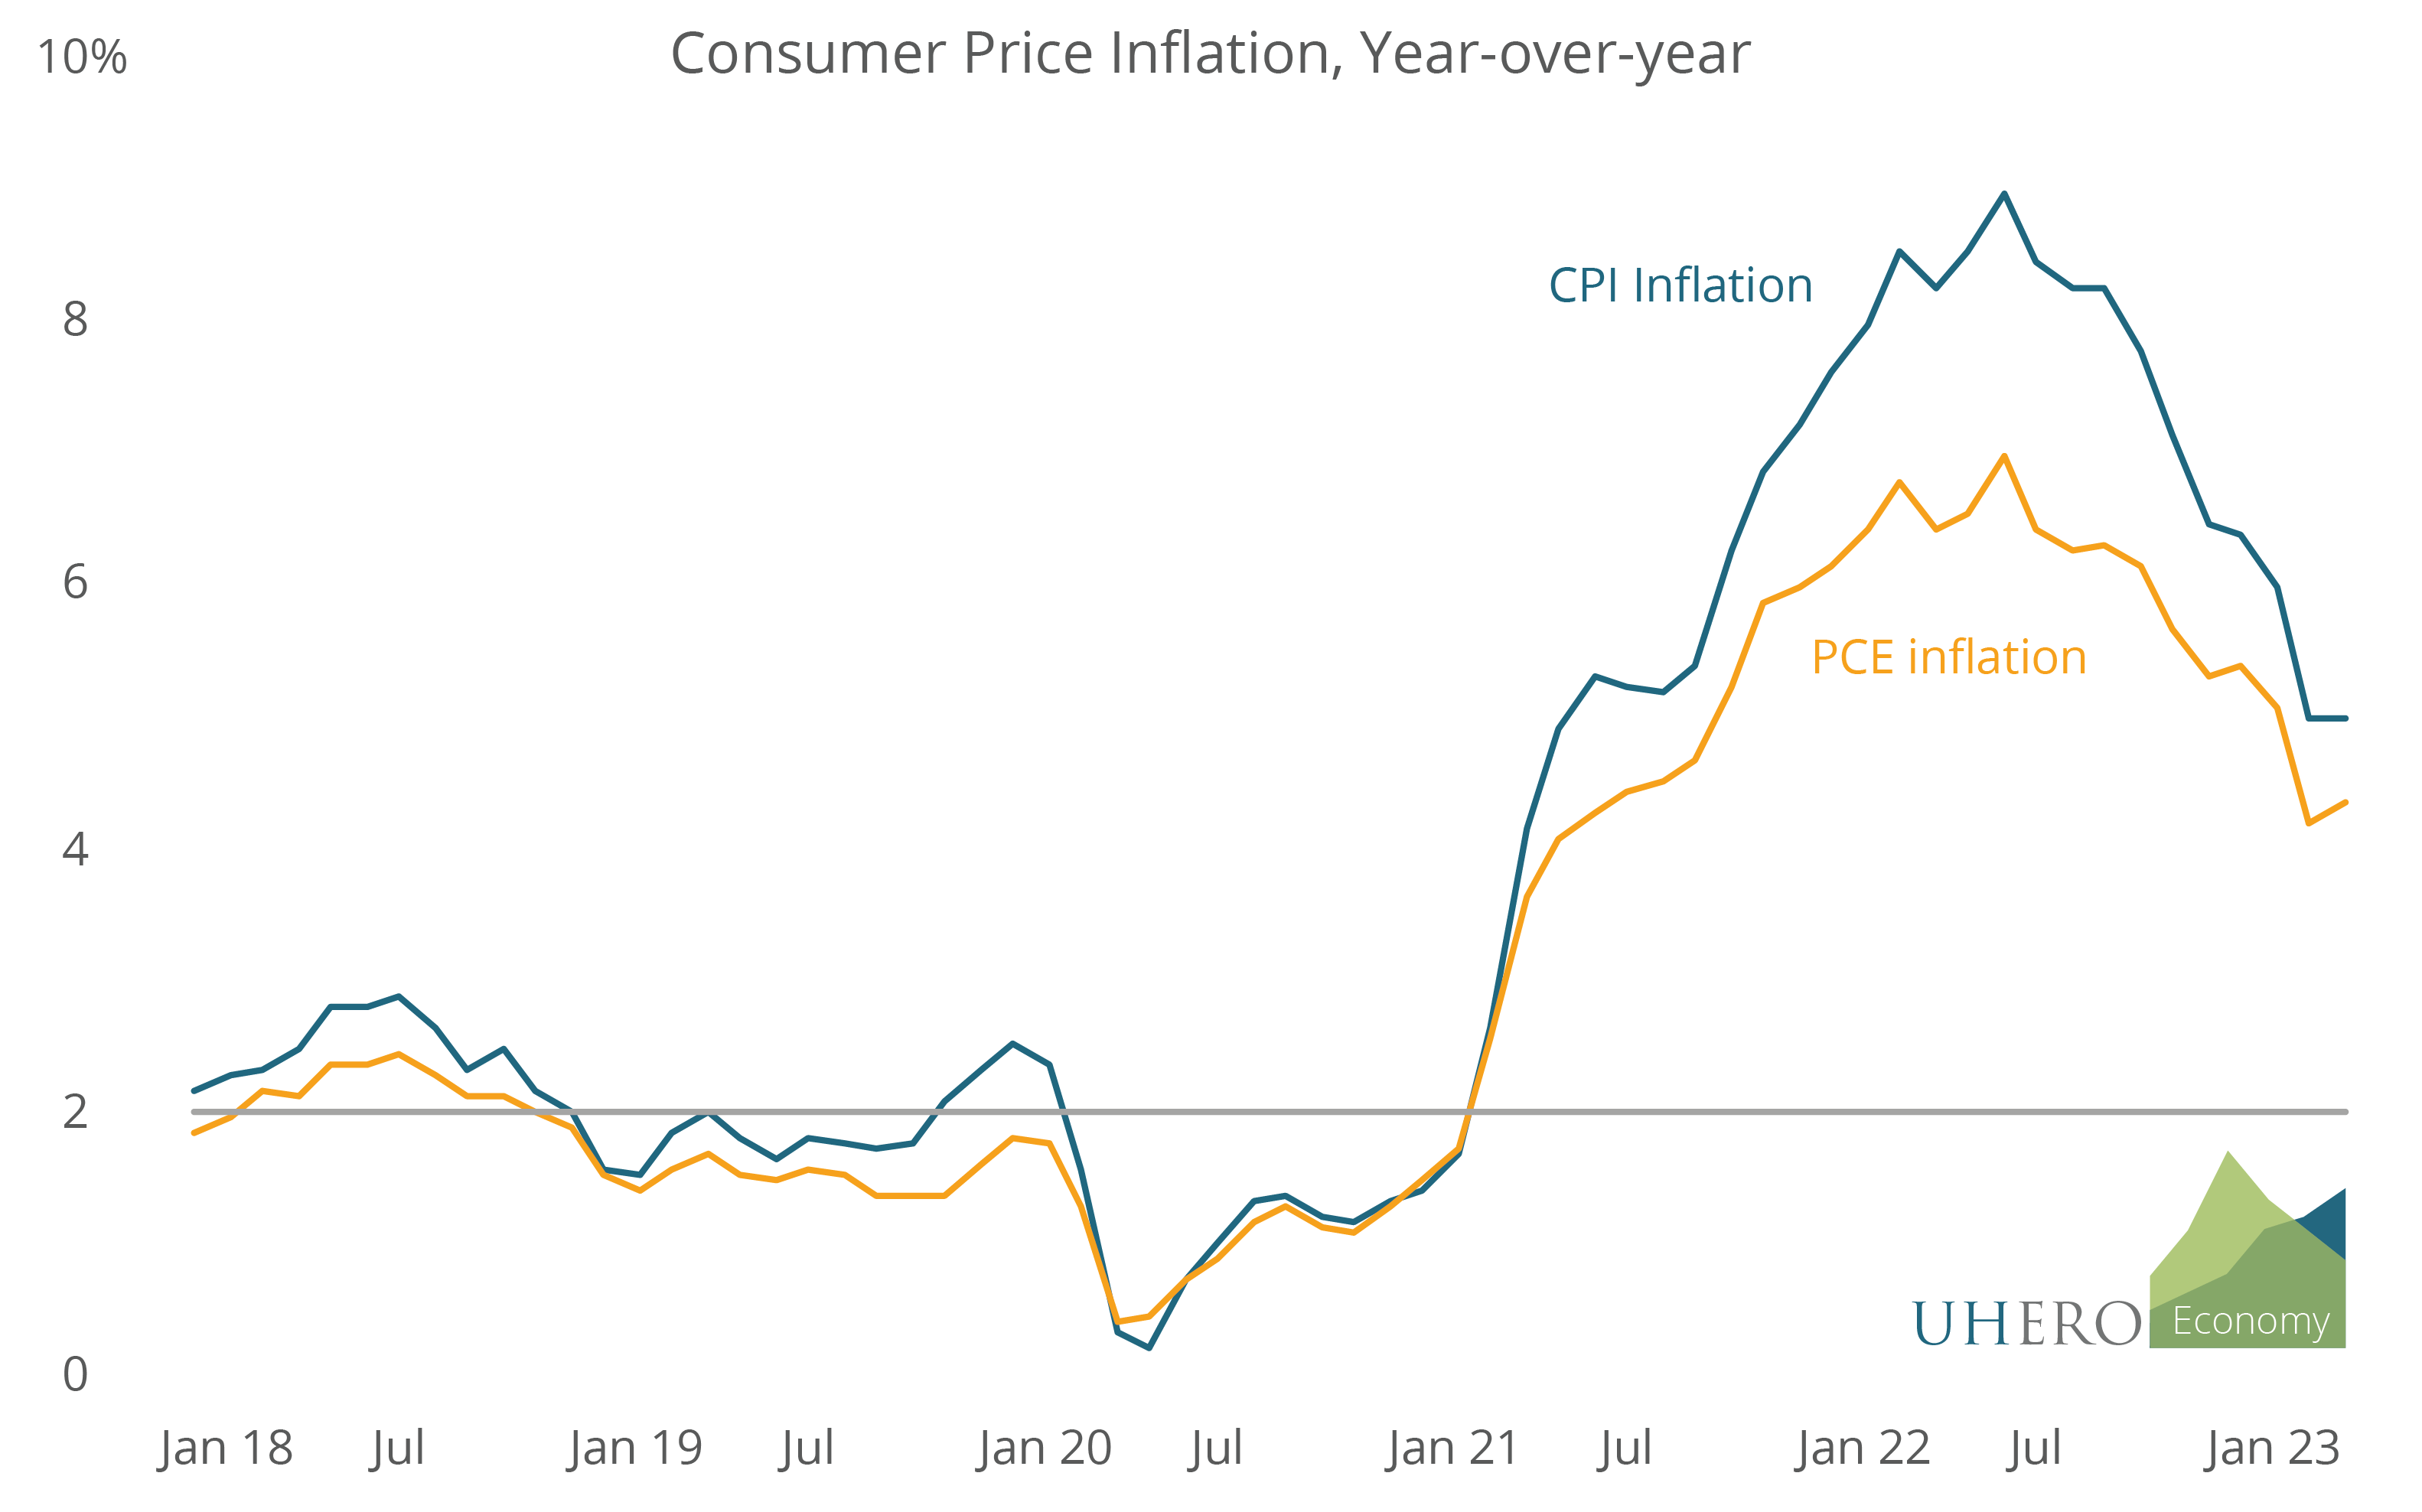
There are two main measures of consumer price inflation. The consumer price index (CPI) measures prices of goods and services purchased directly by the typical urban household. The personal consumption expenditure (PCE) deflator, collected from business data, measures a broader set of consumer purchases, whether made by a household directly or on their behalf by businesses, government, and nonprofits. There are also important differences in how each deals with key prices, as we will see below.
Both measures of consumer prices are showing a downward trend in inflation (with a slight pause in April). Both the CPI and the PCE show inflation falling by roughly half from the peak in the middle of last year.
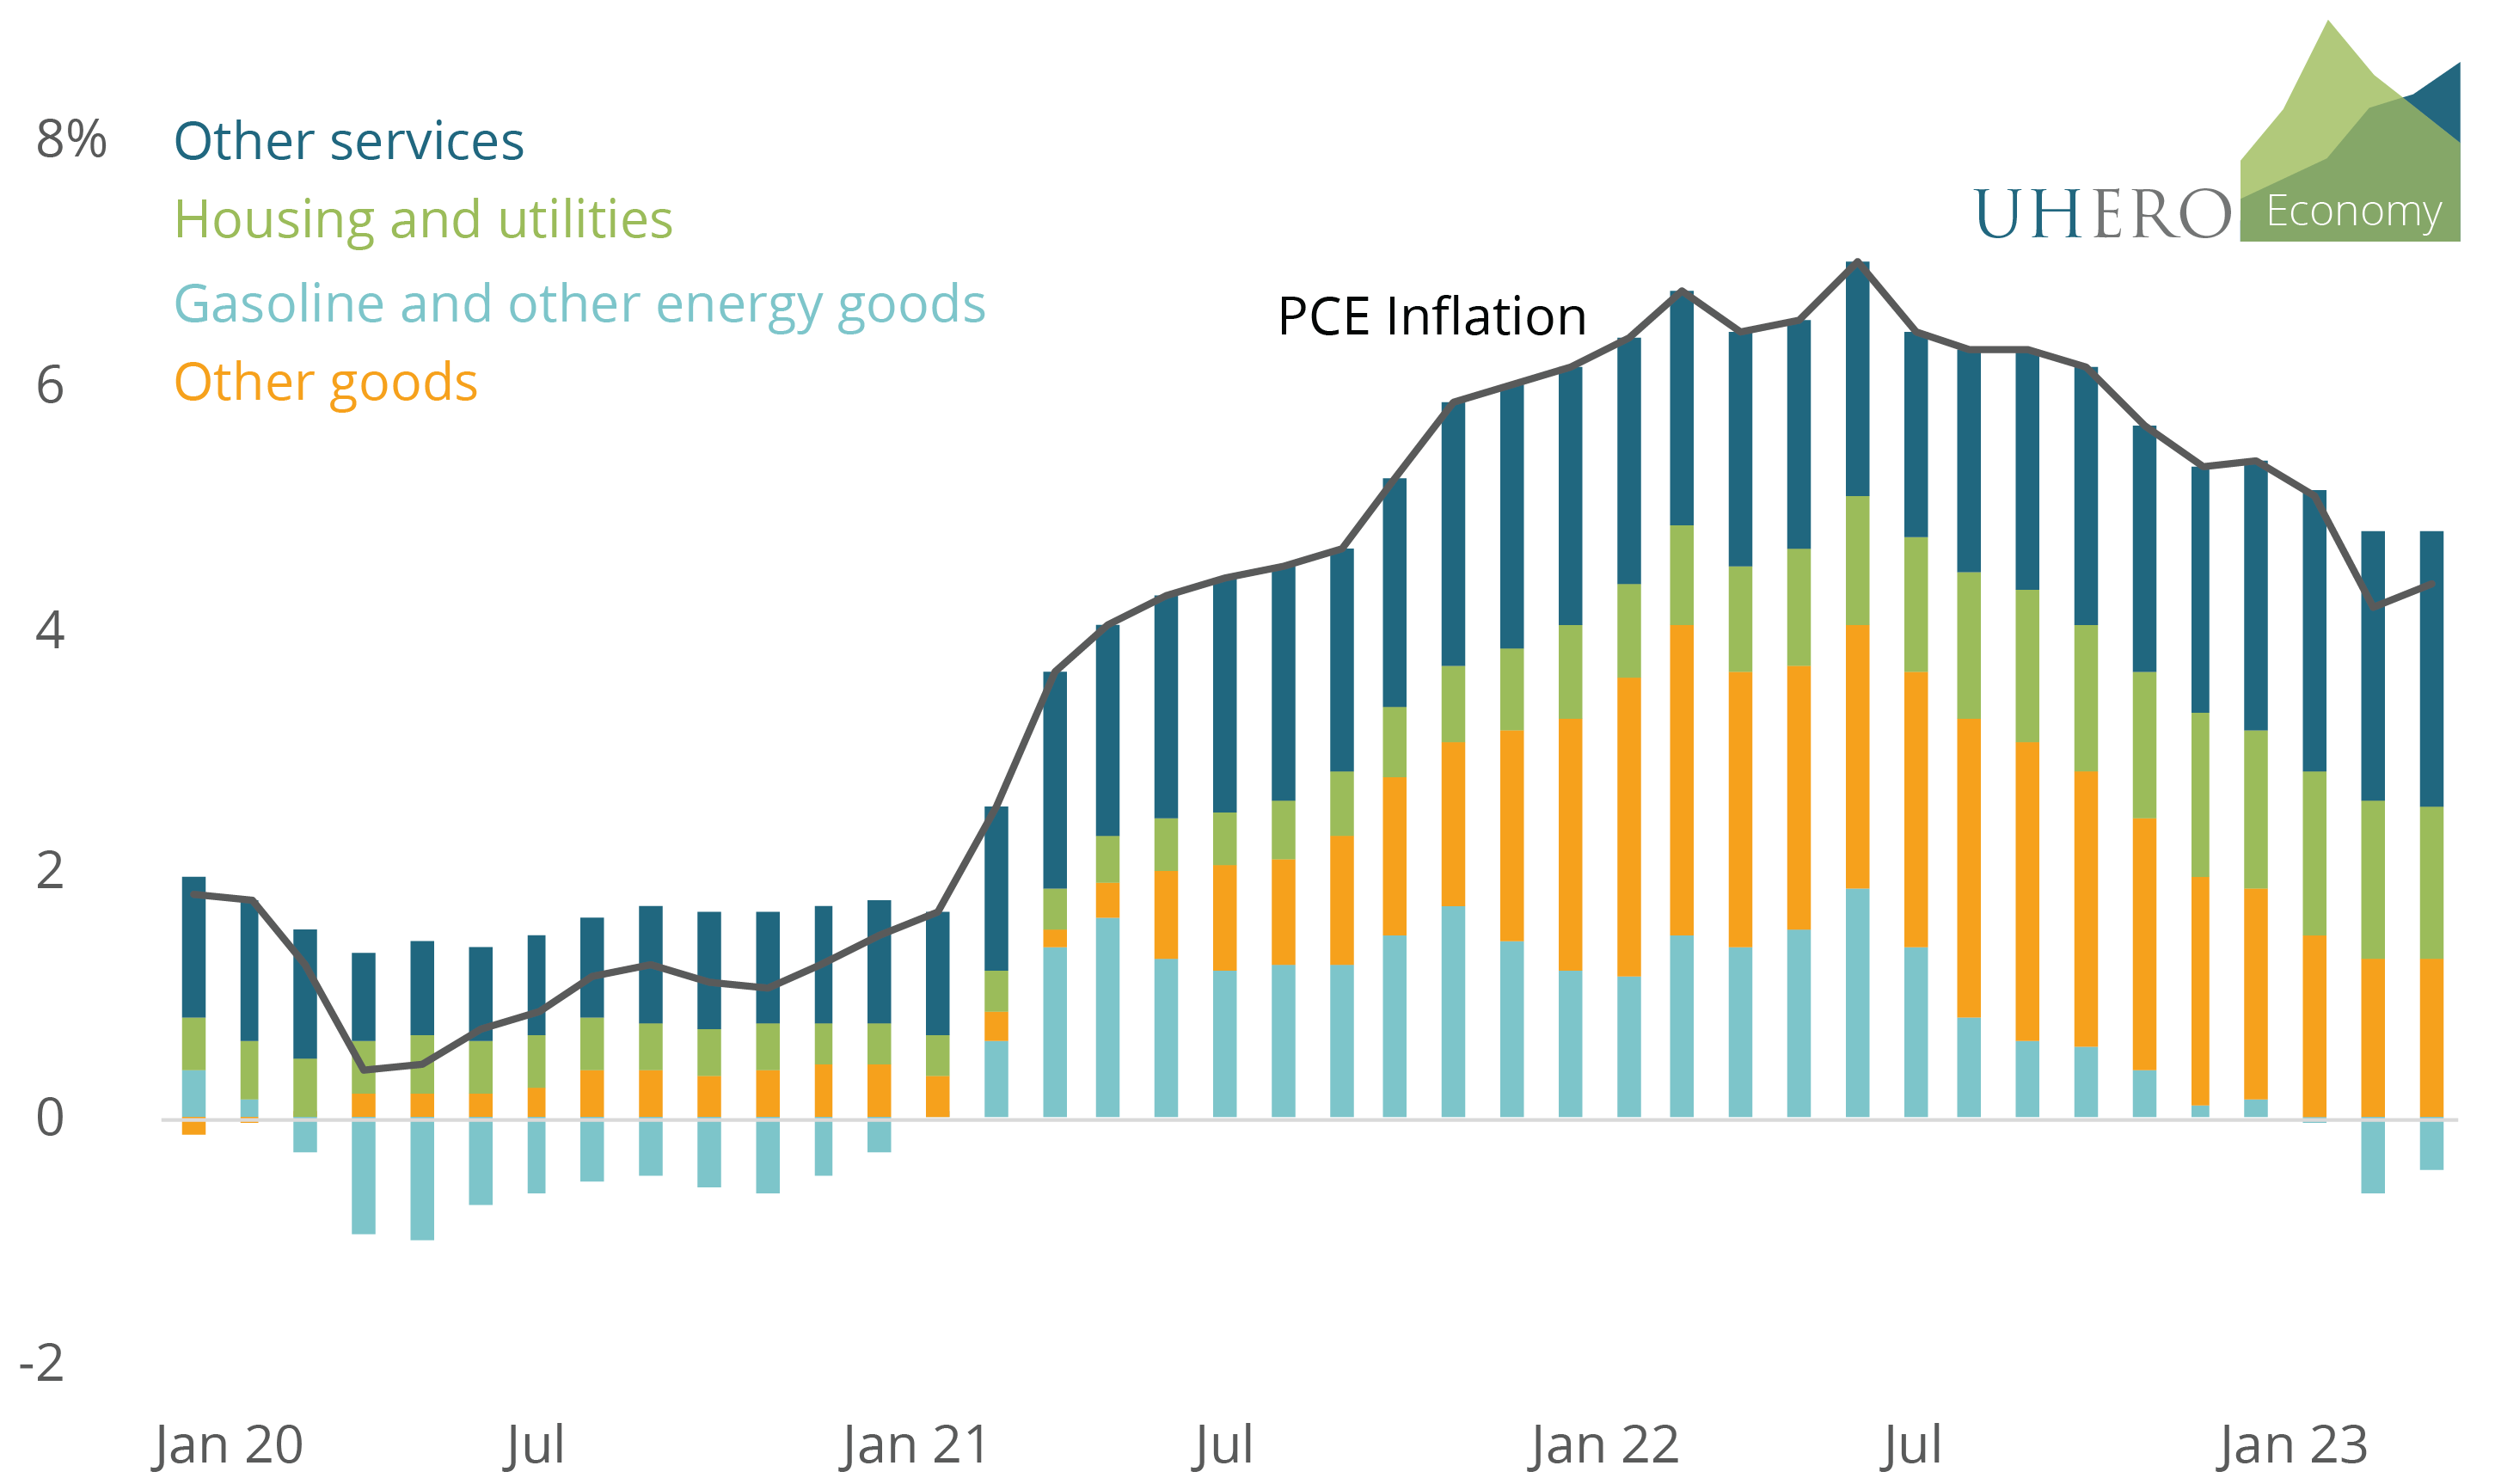
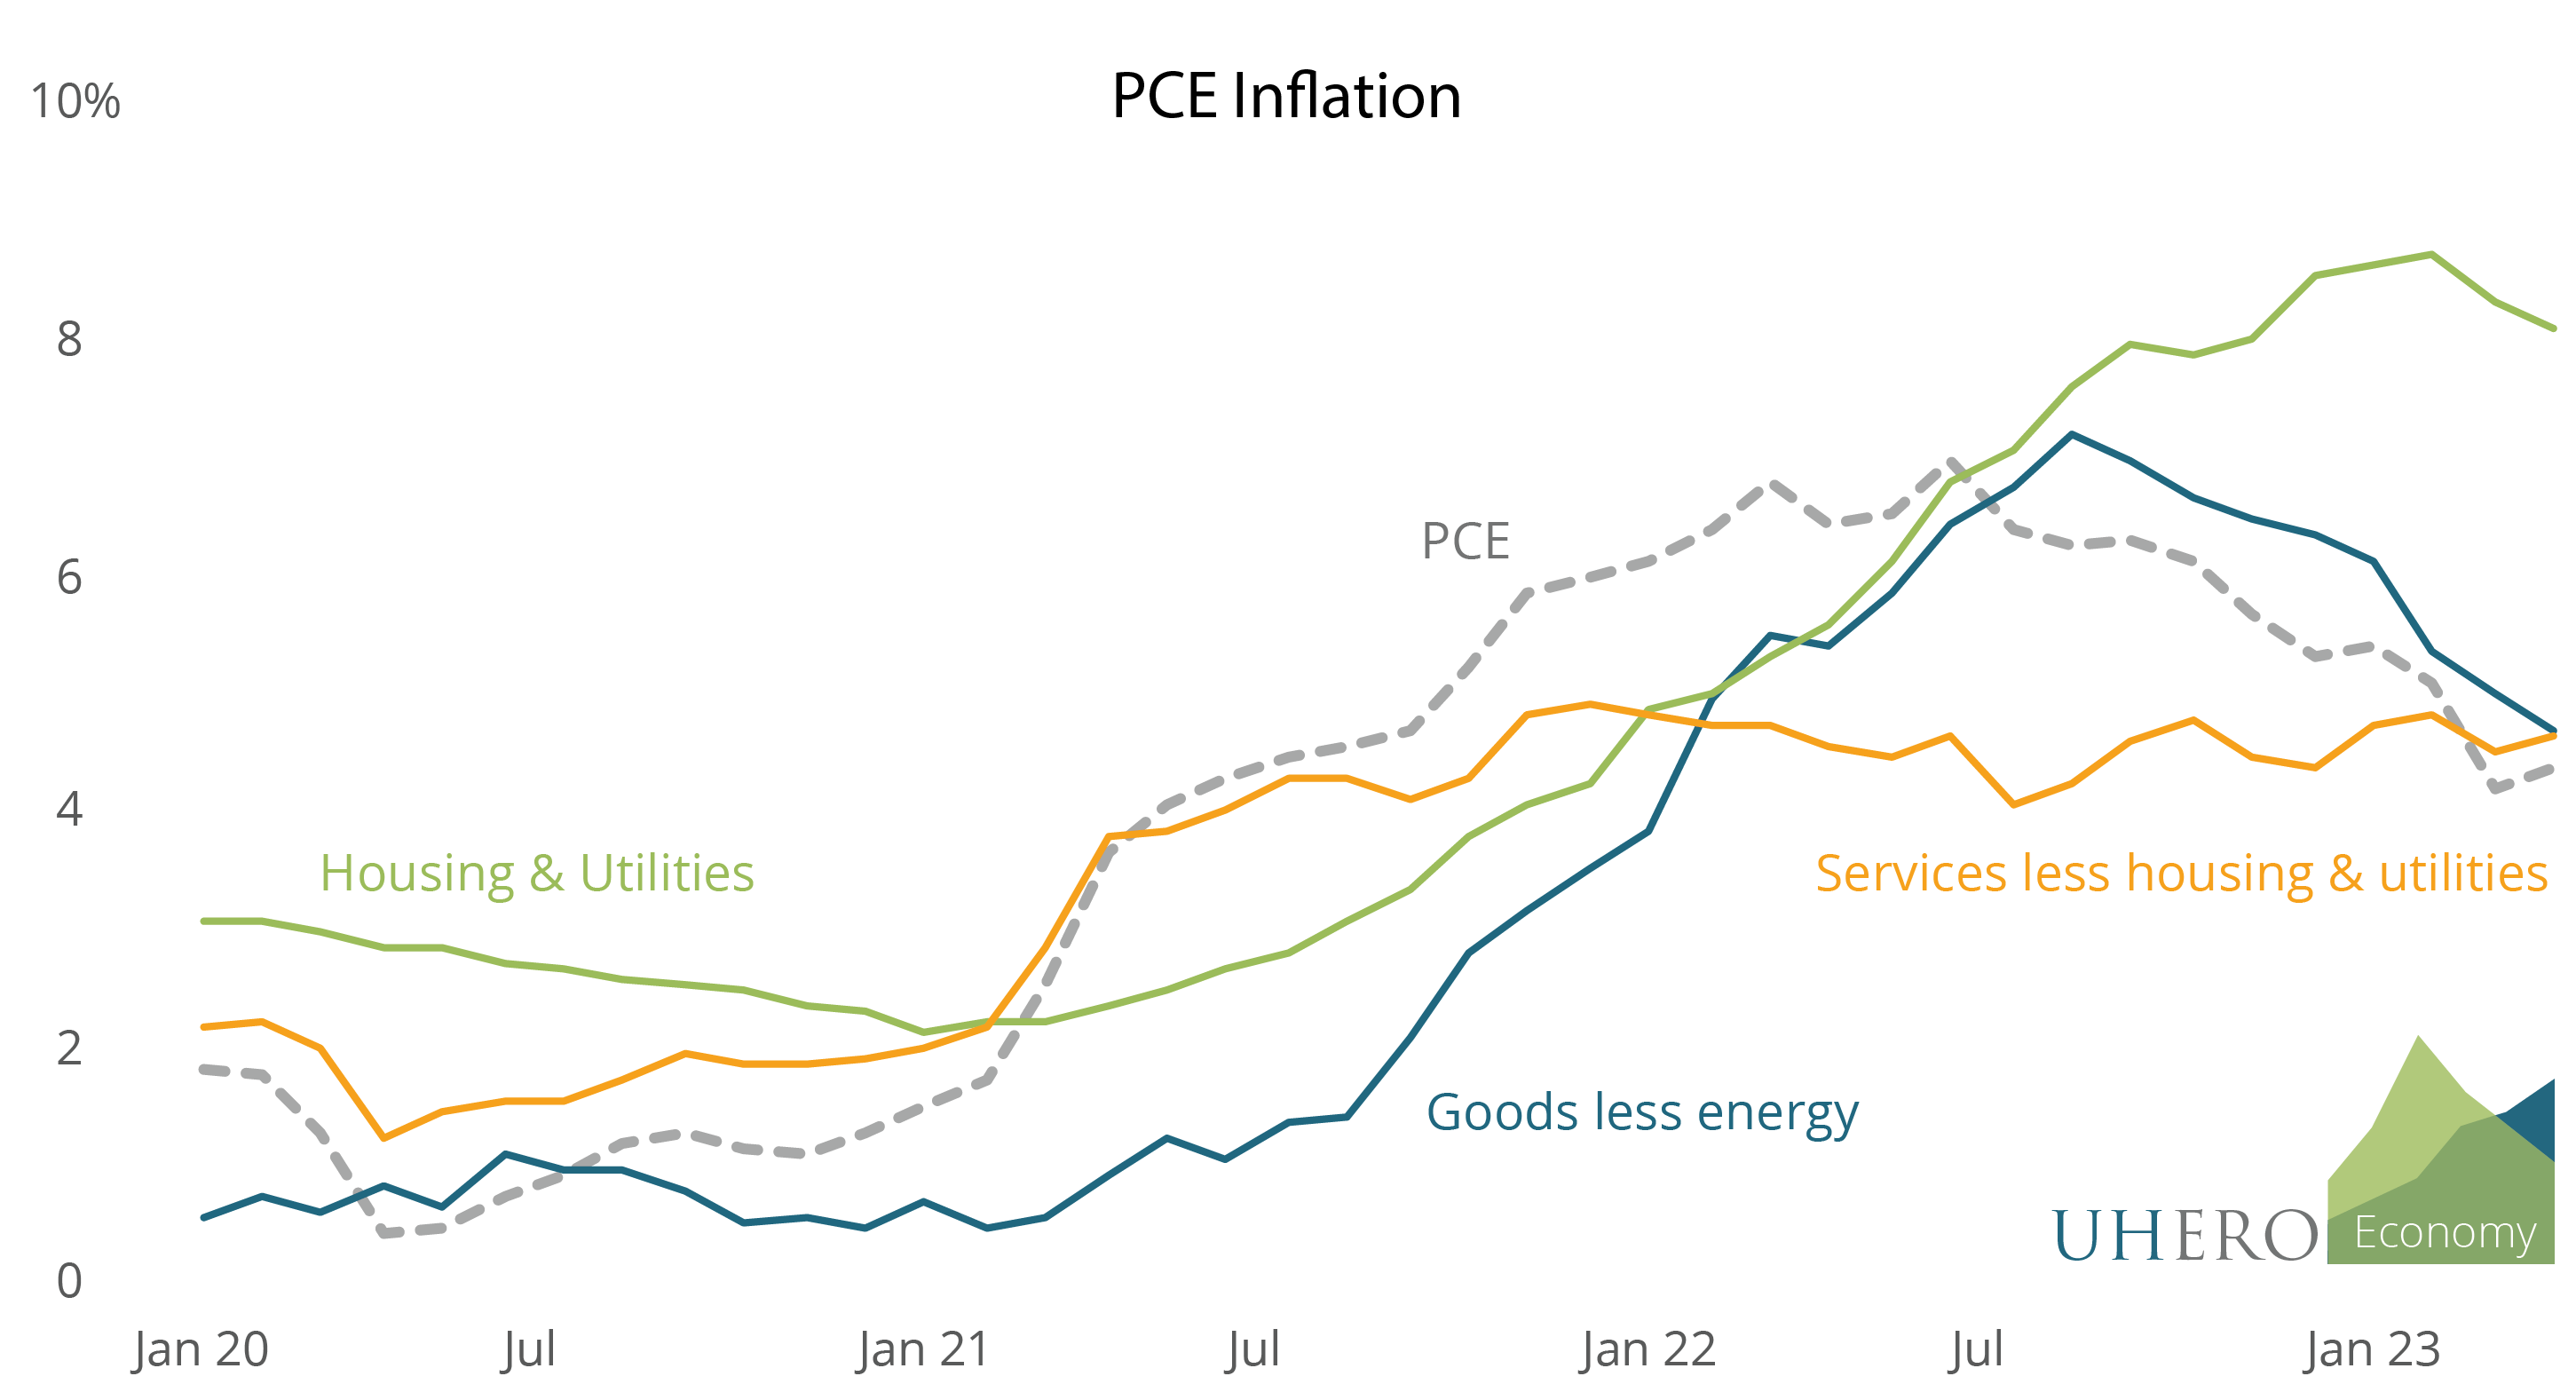
But what they are telling us about the factors contributing to consumer price inflation is quite different. Here are the contributions to inflation coming from different types of spending, in other words, the portion of inflation that is due to price increase in each category of goods and services.
Contributions to Consumer Price Inflation, Year-over-Year
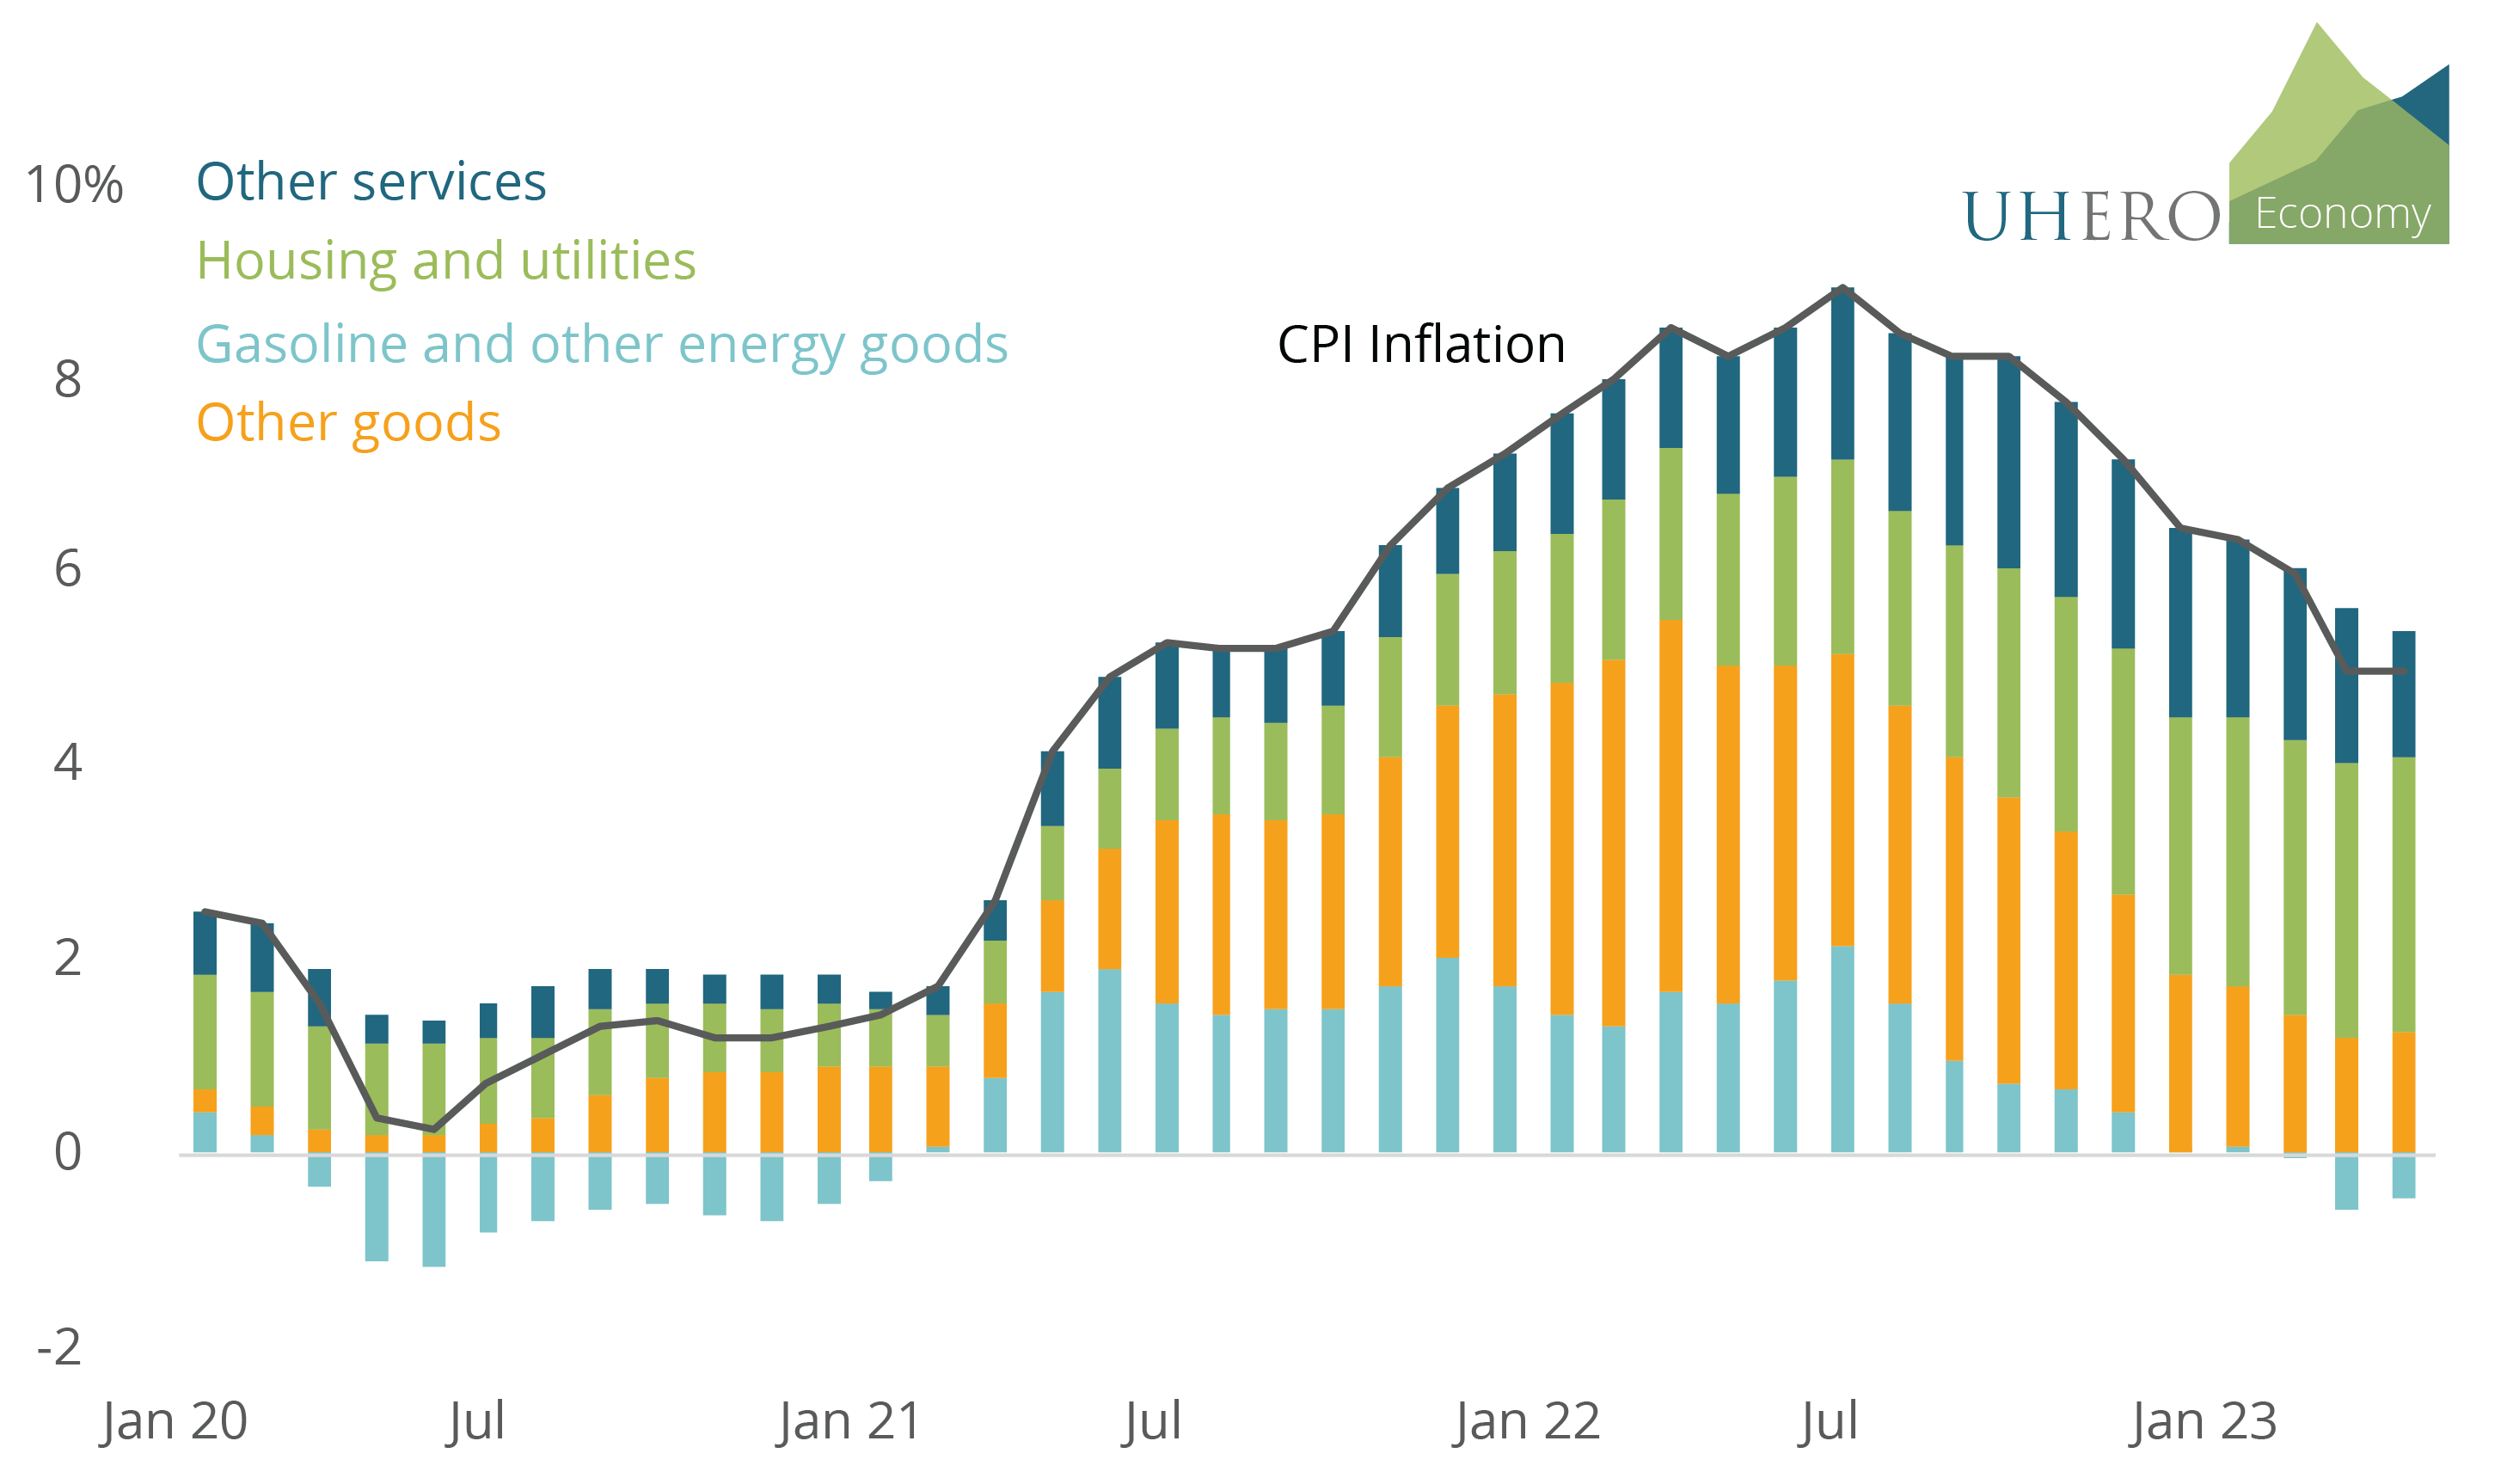
There are several things to note here:
- Overall inflation is different according to the CPI and PCE measures, with the PCE typically running lower than the CPI. CPI inflation over the twelve months ending in April was 5%; according to the PCE, inflation was running 4.4% in April.
- Goods price inflation has receded significantly by both measures, and energy price inflation has turned slightly negative.
- The contribution of housing and utilities has been much larger by the CPI measure than by the PCE.
- And the contribution of the “other services” category (everything except housing and utilities) has been much larger for the PCE measure than it has for the CPI.
The differences in the elements contributing the most to inflation are potentially very important for what they tell us about the likely path of inflation going forward. And therefore, for future Fed policy. Because rents are falling, we expect housing inflation to come down significantly in coming months. But there is much less reason to expect a sharp drop in inflation of other service prices. The latter are labor-intensive activities where substantial labor market weakening may be needed before price increases begin to ease.
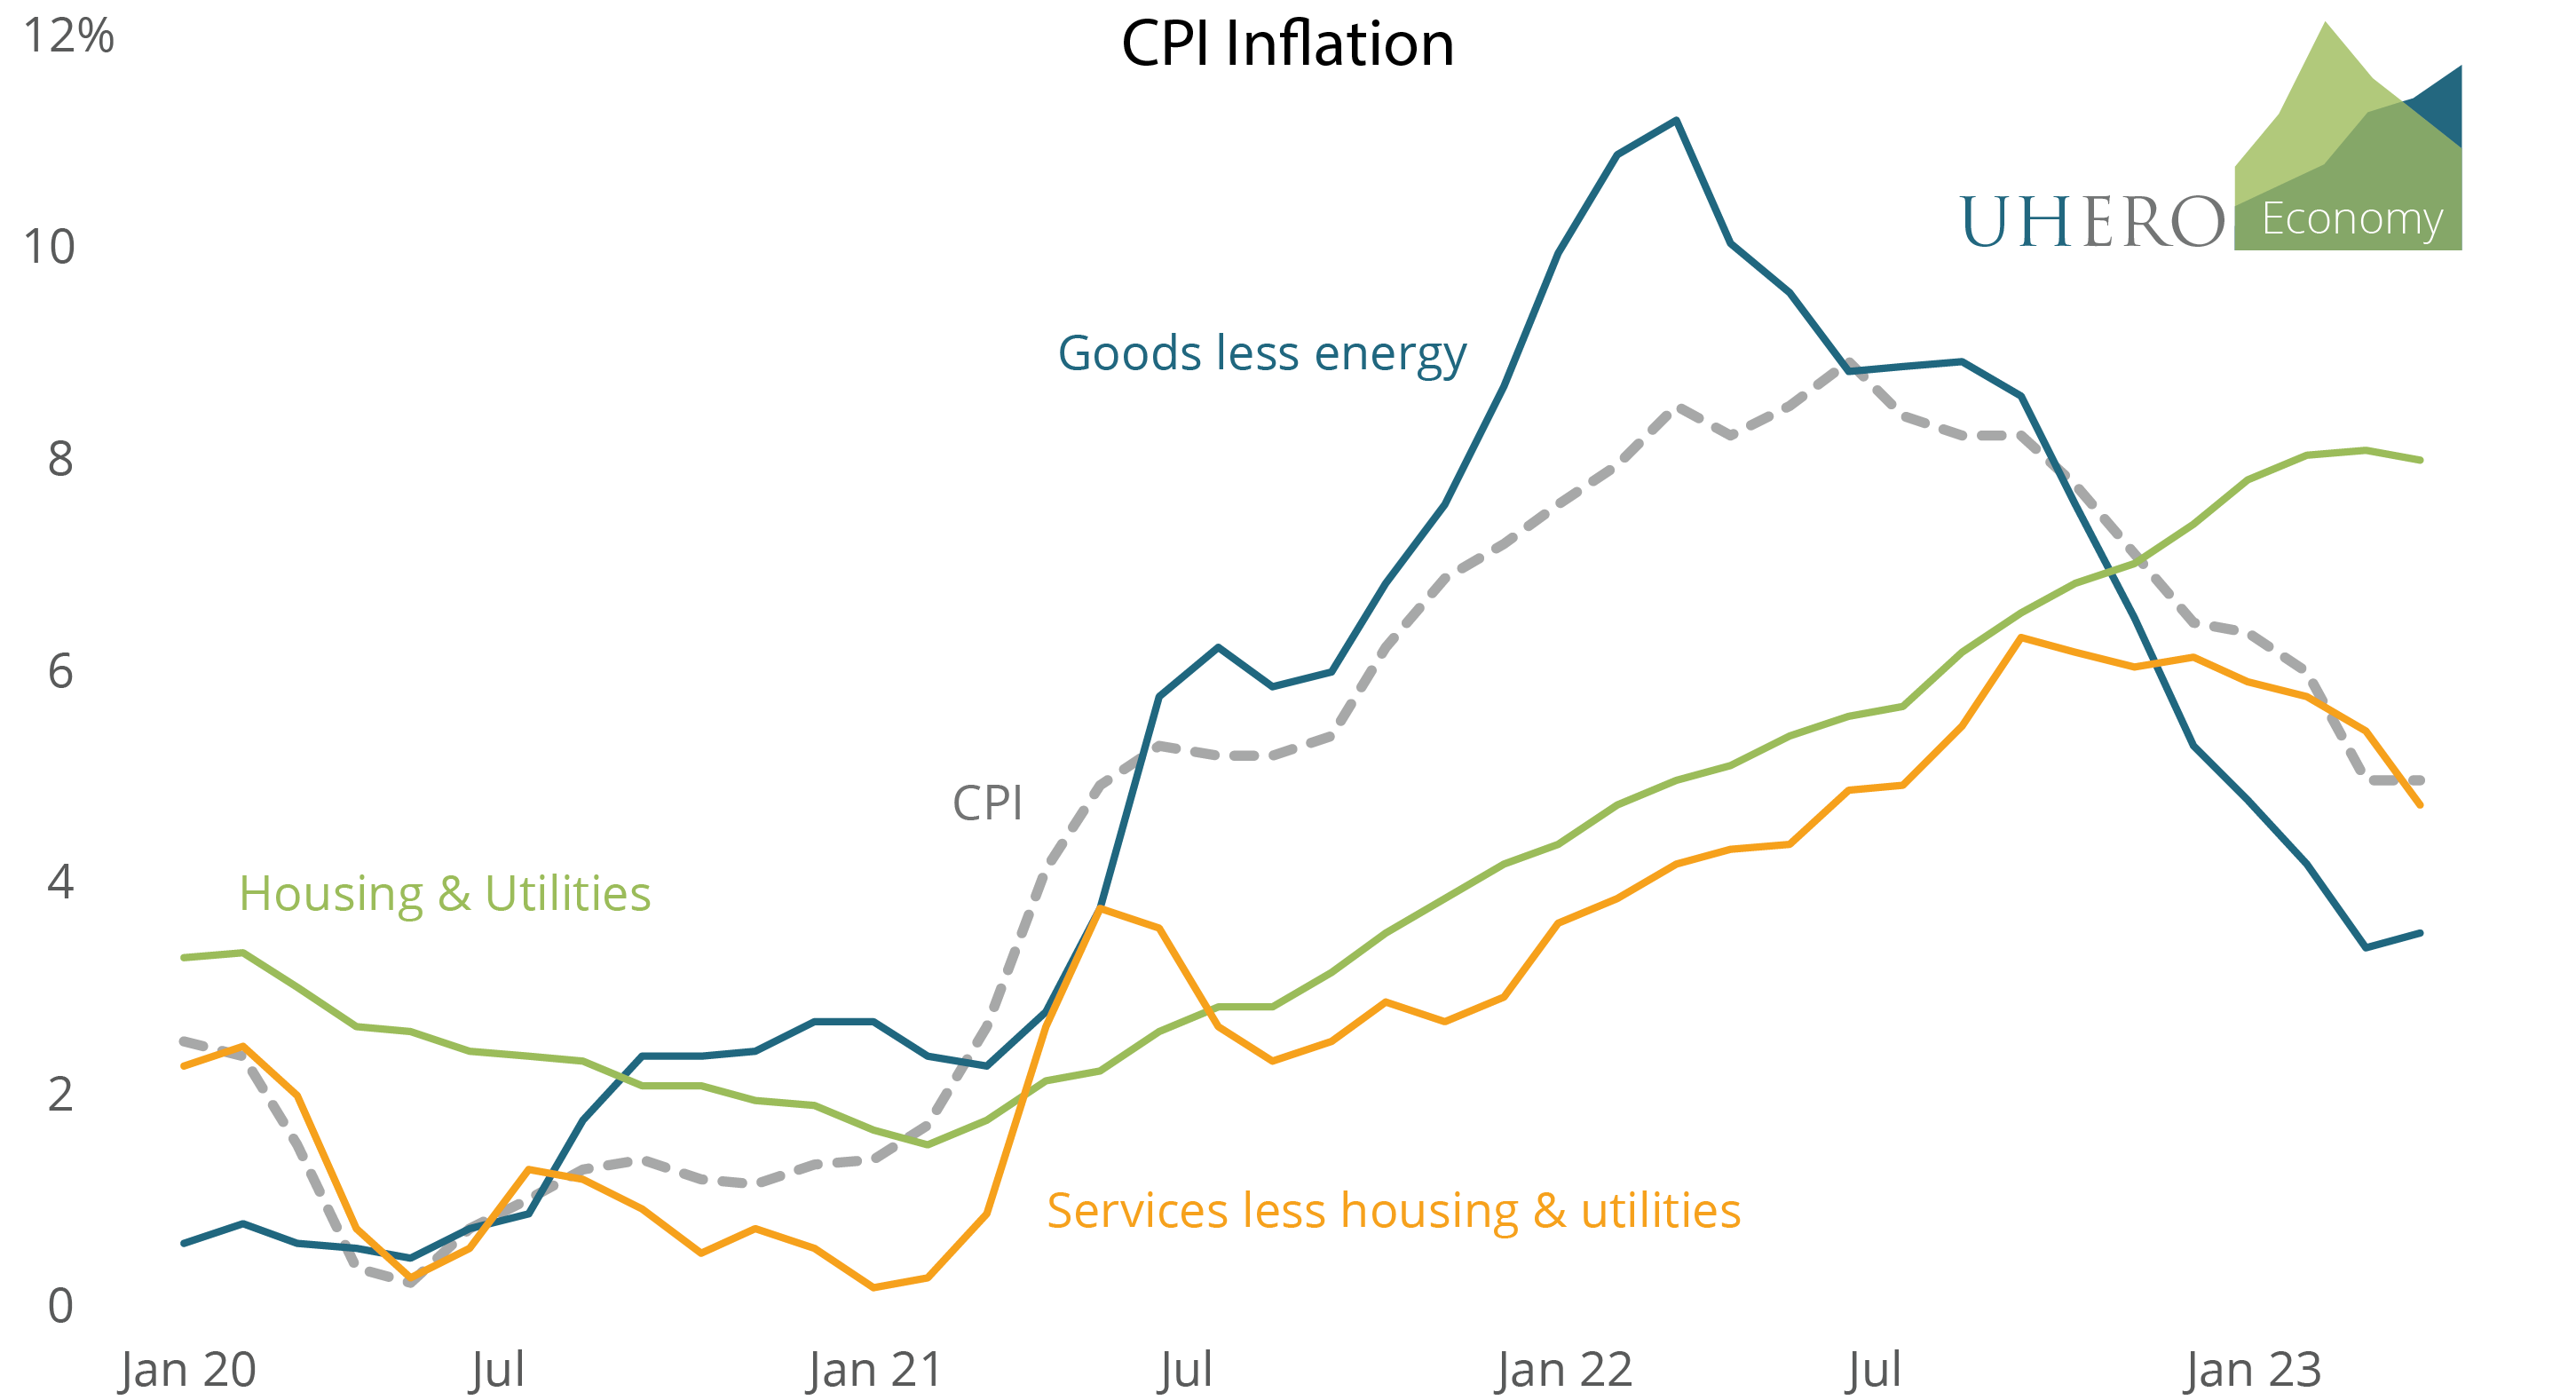
Why do the CPI and PCE measures differ so much in their main underlying components? A limited part is due to different inflation rates for the various categories in the two indexes. Inflation for prices of physical goods has come down faster as measured by the CPI, and inflation in non-housing services shows a downward trend that is not yet apparent in annual PCE inflation.
Consumer Price Inflation by Major Categories, Year-over-Year
But the biggest reason for the differing contributions to inflation of the various categories of goods and services is that the categories represent very different shares of total spending in the CPI’s Consumer Expenditure Survey and the PCE deflator’s Personal Consumption Expenditure Survey. Some categories are therefore accorded very different weights in calculating overall inflation. The differences in weights come from differences in how some items are valued and in the scope of consumer goods and services included in the surveys.
The biggest difference in weights is in the estimate of shelter costs (housing and non-energy utilities), in particular the calculation of housing costs for owner occupants. Neither survey tries to measure housing costs for homeowners directly, but instead estimates what are called “imputed costs” (or “imputed rents”). In the consumer expenditure survey, households are asked what it would cost them to rent their own home to live in, and the estimates they give are rather high. By comparison, the PCEs method of imputing home-owners’ equivalent housing costs is to use a “rent-to-value” approach, which assumes that an owner-occupied unit with the same value as a renter-occupied unit will have the same rental value. These estimates come in much lower, so that the share of household spending on shelter in the PCE is less than half its share in the CPI.
As for non-housing items, consumer spending in the PCE includes an estimate of what consumers spend themselves plus what businesses, governments, and nonprofits spend on their behalf. This is particularly important for health care, where business and government benefits and support provide a significant share of the total spending. Therefore, the contribution of health care to the PCE is more than twice that of its role in the CPI.
| Relative importance of categories in CPI and PCE and measurement | CPI | PCE |
|---|---|---|
| Goods | 38% | 39% |
| Gasoline, energy goods | 4% | 3% |
| Other goods | 34% | 36% |
| Services | 62% | 62% |
| Housing and non-energy utilities | 33% | 14% |
| Other services | 29% | 48% |
| of which, health care | 7% | 16% |
There are other (usually less important) reasons why inflation measures from the two approaches differ, and if you like technical stuff you can read more here. But in the current situation, what we have discussed above gets at the most important points.
So why should we care about the different messages coming from CPI and PCE inflation?
Because the Federal Reserve sees the latter as a better measure of inflation and relies on it when setting interest rate policy. A key concern of the Fed has been the behavior of the “other services” category, which by the PCE measure continues to be the biggest driver of ongoing inflation, with little evidence of slowing. If this continues to be the case, the Fed is more likely to keep interest rates higher for longer, or even make additional interest rate hikes in coming months.
That would be painful news for all of us.
A note for the detail-minded: I have focused here on inflation measured on a year-over-year (12-month) basis. You can do a similar analysis using instead inflation measured over six-month periods. I’ll avoid that here, because we don’t really need to muddy the water further (do we?). It tells a similar story, but with an even more pronounced difference between how fast CPI inflation has come down compared with the PCE. But the issue remains the same: as long as the Fed is looking at the PCE, it will be more concerned about the risk that ongoing service price hikes will keep inflation elevated.