The popular media is frequently citing opinion polls that indicate preferences for one presidential candidate or another. Historically, analysts have found that economic conditions are among the most important factors influencing voting behavior, and this may be especially true this year amid ongoing economic challenges. In order to find a causal link between economic conditions and voter preferences, one needs to build an explanatory model. The model serves two purposes: it can be used to estimate the strength of the relationship between an economic indicator and the outcome of the election, and it can be used for making predictions.
Ray Fair, an economist at Yale University, maintains an econometric model of presidential election outcomes that has been very accurate in the past, predicting correctly the winner in 21 out of the last 24 elections (the wrong calls were for 1960, 1992, and 2000). He found that inflation and the growth rate of real gross domestic product have historically had a significant impact on election outcomes. These two indicators appear to have equal and opposite effects in voters’ minds: a 1% increase in the inflation decreases the vote share for the incumbent by 0.6%, and a 1% increase in GDP growth increases the incumbent’s vote share by 0.6%. Despite a couple of oil/gasoline price spikes, inflation has remained fairly stable over the past four years. Therefore, according to the Fair model, it is the slow growth that should be raising red flags for the current occupant of the White House.
What is missing from Fair’s model is a measure of employment, which lags overall output growth in general, but especially in the current recovery. Charles Tien and Michael Lewis-Black found that a 1% increase in employment growth has historically led to a 0.5% increase in vote share for the incumbent. Still, as a result of the low employment levels at the onset of the Obama presidency, voters may require an even faster job growth in exchange for 0.5% of their votes.
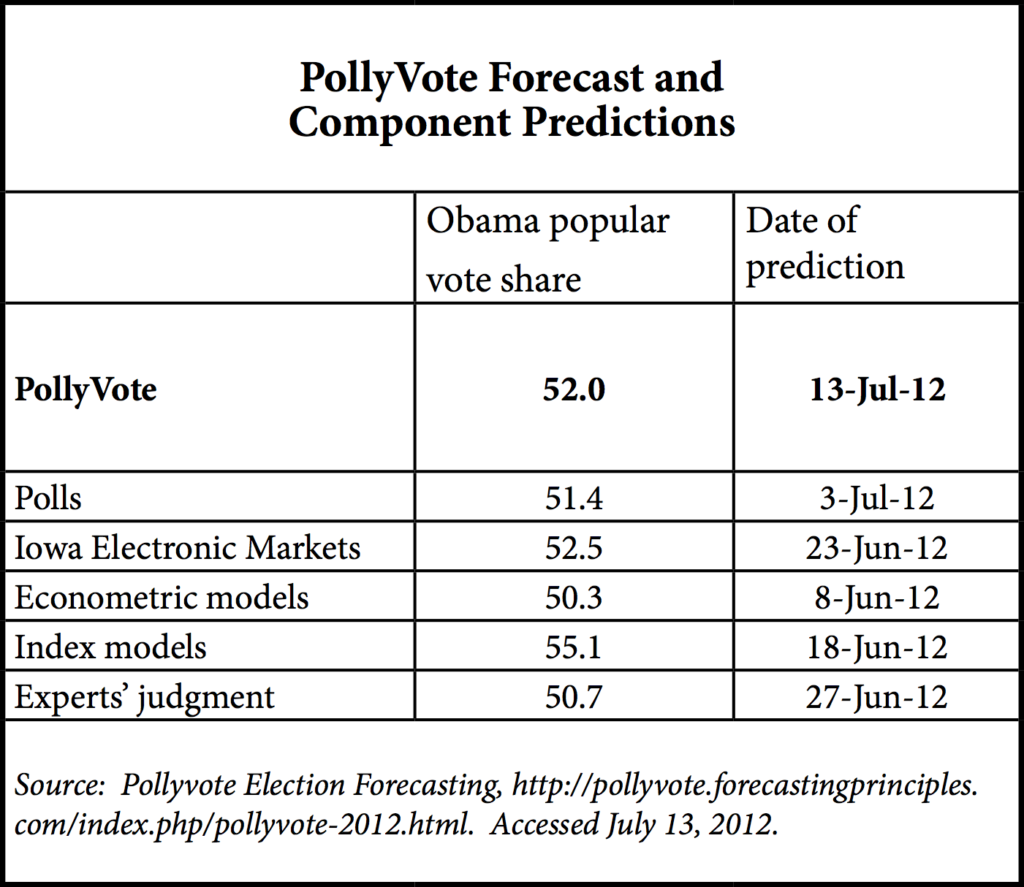
Given the most recent economic data, the two econometric models discussed above are fairly pessimistic about president Obama’s reelection prospects. He is expected to get 50% and 48% of the popular vote according to the Fair model and the Tien-Lewis-Black model, respectively. This is in contrast to a 56% chance of winning (a different measure) indicated by intrade.com, a prediction market where money talks. The PollyVote website calculates average vote-shares for five different prediction methods, and as the table indicates, econometric models tend to give the lowest vote-share to president Obama. The other models, however, are not (solely) based on economic determinants of electoral success, and capture additional factors affecting election outcomes. For example, the president may draw some comfort from Philippe Jacquart of Wharton, who found that augmenting the Fair model with a measure of charisma improves the model’s performance to pick the winner in 23 out of 24 elections. And state level results from other studies are tilted a bit more toward the president’s reelection than are the national popular vote-share forecasts.
– Peter Fuleky