In April, US non-farm payroll jobs rose by a meager 115,000, and the unemployment rate fell slightly from 8.2% to 8.1% according to the Bureau of Labor Statistics. The lower unemployment rate resulted from a 196,000 decline in employment and an even larger 342,000 drop in the labor force. The civilian labor force participation rate fell to 63.6%, a level not seen since December 1981. The number of unemployed persons remained steady at 12.5 million, out of which 41.3% have been without a job for more than six months. April’s disappointing job market performance was somewhat mitigated by the revisions to prior months. Non-farm payroll growth was revised from 240,000 to 259,000 for February, and from 120,000 to 154,000 for March.
It is important to note that the labor force participation rate has been declining not just for cyclical but also for demographic reasons. One of the key factors affecting this measure is the age of the labor force, which has been influenced by a couple of trends in the last two decades. First, the 16 to 24 year age group has had a declining participation rate, which prior to the recession was predominantly caused by increasing college attendance. More recently, the participation rate of this age group has suffered from the recession as well. Second, the 55 year and older age group has been experiencing an increasing participation rate, perhaps due to less strenuous jobs, but also because of financial need since the start of the recession. Still, with the leading edge of the baby-boom generation beginning to retire, the labor force participation rate ten years from now is expected to be lower than it is today. Mitra Toossi, a Bureau of Labor Statistics economist projects the labor force participation rate to fall to 62.5% by 2020.
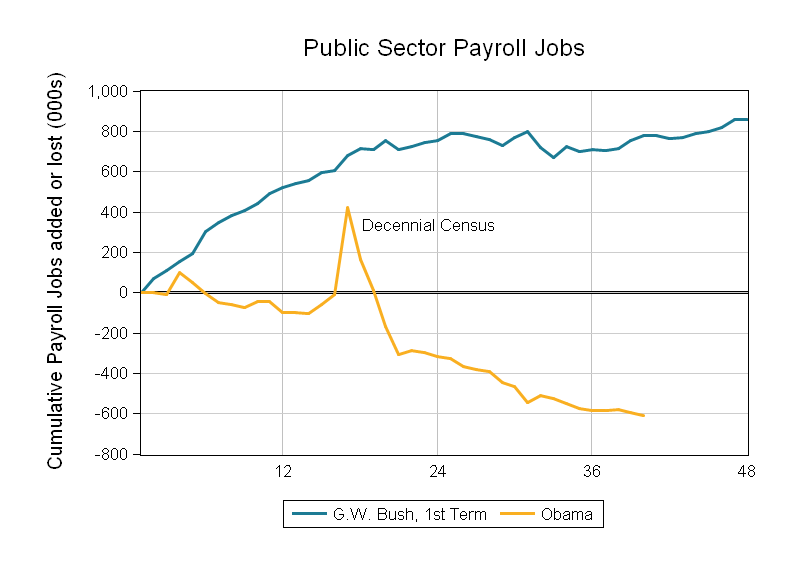
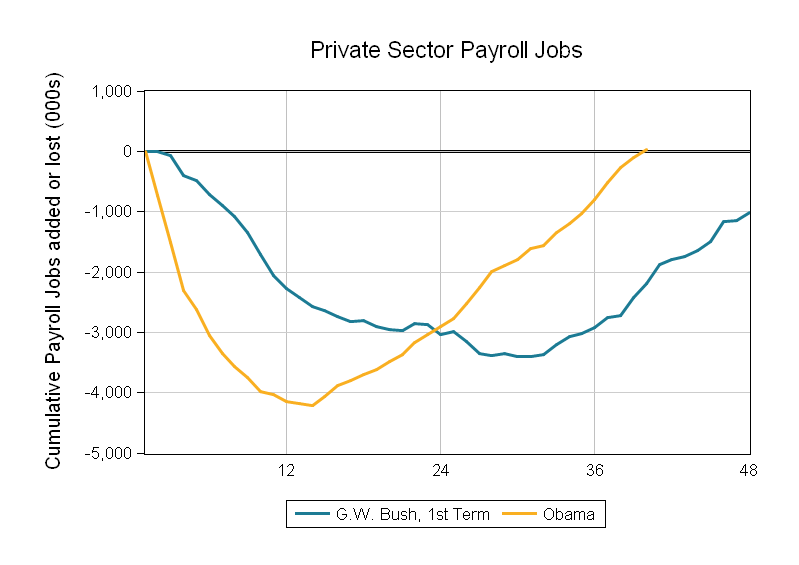
A frequently overlooked characteristic of the slowly recovering job market is the discrepancy between the growth of private sector versus public sector jobs. While the private sector has had an uninterrupted streak of job gains for the last two years, the public sector lost jobs in 20 out of the past 24 months. The graphs below (originally published by Calculated Risk) illustrate the evolution of the two labor markets since the start of the Obama presidency. For comparison the figures also show the first term of the G. W. Bush presidency, which was affected by a stock market crash and the ensuing 2001 recession. There is a large difference between the private and the public job markets under the two presidents.

Although there was strong government job creation in the early 2000’s, the public sector job count has been mostly on a downward trend in the current business cycle.

On the other hand, private sector jobs have already rebounded to their January 2009 level in the present recovery, whereas the first term of G. W. Bush ended with fewer private jobs than it started. Note that by the time president Obama took office, the country had already lost 4.6 million private sector jobs, and therefore we have a long way to full recovery ahead of us.
– Peter Fuleky