BLOG POSTS ARE PRELIMINARY MATERIALS CIRCULATED TO STIMULATE DISCUSSION AND CRITICAL COMMENT. THE VIEWS EXPRESSED ARE THOSE OF THE INDIVIDUAL AUTHORS. WHILE BLOG POSTS BENEFIT FROM ACTIVE UHERO DISCUSSION, THEY HAVE NOT UNDERGONE FORMAL ACADEMIC PEER REVIEW.
By James Mak, Justin Tyndall and Carl Bonham
In 2019 Hawaii recorded one of the lowest unemployment rates in the country at 2.8%. Only five states—Colorado (2.6%), New Hampshire (2.6%), Utah (2.6%), Vermont (2.3%) and North Dakota (2.3%)—had lower unemployment rates. The U.S. average was 3.7%. Hawaii’s annual average unemployment had been below 3% every year since 2017. Yet, Hawaii’s labor market has not been nearly as strong as the official unemployment rate might suggest. Besides the well-known official unemployment rate, the U.S. Bureau of Labor Statistics (BLS) publishes five other less well-known measures of “labor underutilization.” Here, we compare the official unemployment rate that is widely reported in the media (U-3) and the broadest measure of underemployment (U-6). The findings are sobering.
The official concept of unemployment (U-3) includes all those who are unemployed divided by the total labor force. In 2019, Hawaii had 18,700 unemployed residents and a labor force of 661,200. Hawaii’s official unemployment rate was 2.8%. (These numbers are based on survey data and slightly different from BLS’s official, model-generated estimates from the Local Area Unemployment Statistics program that UHERO displays on our data portal.)
The broadest measure of unemployment, U-6, includes those who are unemployed (18,700 in 2019) plus those who are employed part-time even though they would rather work full-time (19,700), plus all those who are “marginally attached” to the labor force (7,000). (People who are marginally attached to the labor force are those who are neither working nor currently looking for a job but indicate that they want and are available for a job, have looked for one in the past 12 months, but not in the past 4 weeks. They are not officially in the labor force. We refer to them as “people who want a job”.) These three categories of “labor underutilization” totaled 45,400 residents, or 6.8% of the civilian labor force plus all persons who want a job. Residents who were involuntarily working part-time and those who want a job far exceeded those who were officially classified as unemployed. Twenty-three other states had lower U-6 rates than Hawaii.
People Who Want a Job and Involuntary Part-Time Workers
States that have high labor underutilization ratios of U-6 to U-3 (say, above the national average of 1.9) have relatively high rates of underemployment. Before the COVID-19 outbreak, Hawaii’s underutilization ratio was 2.5 (2019: Q2–2020: Q1). The next closest state, Colorado, had a ratio of 2.4, followed by Virginia (2.3), Vermont (2.3), Florida (2.2) and Maine (2.2).
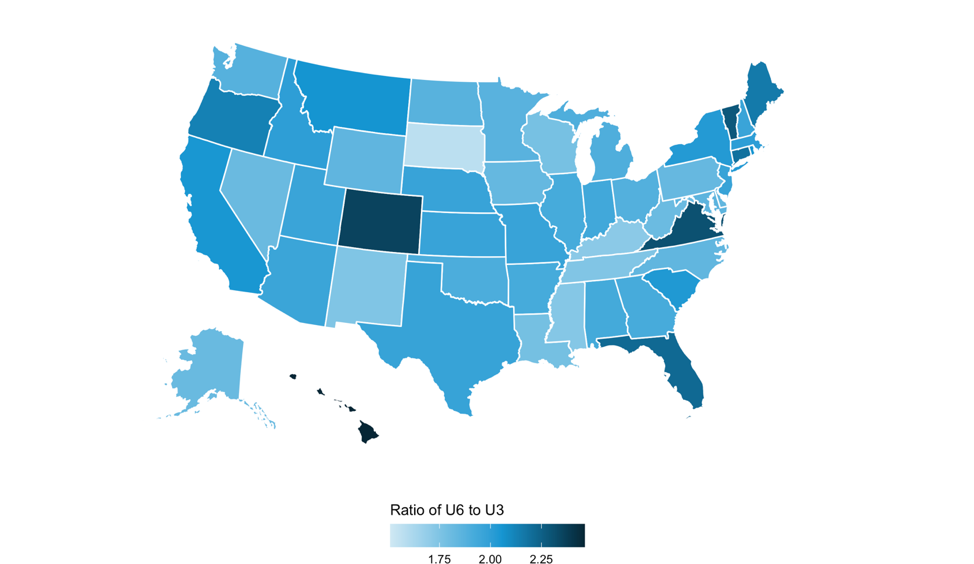
Like Hawaii, all of those states, except Virginia, are highly dependent on tourism. However, Nevada (1.8), which is the most tourism dependent state in the country, is conspicuously absent from this Top Five list.
Hawaii’s Rising Unemployment Rate in 2020
The U.S. Bureau of Labor Statistics (BLS) issues monthly employment data by state. Table 1 displays the number of employed and unemployed persons, the civilian labor force, and the unemployment rate in Hawaii for the months of January 2020 to May 2020. March 2020 was the low point of unemployment in Hawaii in 2020. (The June employment data will be released soon and will be available on UHERO’s data portal.) The effect of the pandemic and subsequent lockdown on the state’s labor market is quite striking.
| Table 1 COVID-19’s Impact on Hawaii’s Labor Market, 2020 | ||||
|---|---|---|---|---|
| Month | # Employed | # Unemployed | Civilian Labor Force | Unemployment Rate |
| January | 650,400 | 17,800 | 668,200 | 2.7% |
| February | 651,200 | 17,900 | 669,100 | 2.7 |
| March | 649,800 | 16,000 | 665,700 | 2.4 |
| April | 482,800 | 150,900 | 633,700 | 23.8 |
| May | 490,700 | 143,200 | 633,900 | 22.6 |
| Source: BLS, via UHERO Data Portal | ||||
A person who is officially unemployed is still in the labor force. Thus, the number of people employed in January (650,400) plus the number of people unemployed (17,800) equals the civilian labor force (668,200). Table 1 shows the sharp decline in employment between March and April, a decline of 167,000. Unemployment rose during the same period by 134,900 and the labor force declined by 32,000. The sharp rise in Hawaii’s unemployment rate from 2.4% in March to 23.8% in April would have been even more pronounced if the labor force had not declined by 32,000 persons. If the labor force did not fall, and the number of people unemployed increased by the full decline in employment, Hawaii’s unemployment rate would have been 27.5% in April instead of 23.8%.
Did those who quit the labor force in 2020 all end up at the fringe of labor market looking in (i.e. the “marginally attached”)? BLS doesn’t publish state level monthly statistics of the other five measures of labor underutilization; it publishes only four-quarter moving averages. The latest available data predates the full impact of COVID-19. So we have to look to the Great Recession, which began in December 2007, to see how Hawaii’s labor market adjusted to a sharp economic contraction. Table 2 displays Hawaii’s labor market data between 2007 and 2012.
| Table 2 Impact of the Great Recession on Hawaii’s Labor Market: 2007-2012 | ||||||
|---|---|---|---|---|---|---|
| Year | Civilian Labor Force | # Employed | # Unemployed | # Involuntary Part-Time | # Want a Job | Unemployment Rate (U-3) |
| 2007 | 646,800 | 628,200 | 18,600 | 17,800 | 5,100 | 2.9% |
| 2008 | 660,200 | 632,500 | 27,700 | 24,600 | 6,700 | 4.2 |
| 2009 | 639,800 | 592,300 | 47,500 | 42,000 | 11,800 | 7.4 |
| 2010 | 628,000 | 584,100 | 43,900 | 51,400 | 13,400 | 7.0 |
| 2011 | 632,700 | 586,500 | 46,200 | 39,200 | 11,600 | 7.3 |
| 2012 | 641,900 | 603,200 | 38,600 | 34,000 | 10,600 | 6.0 |
| Source: https://www.bls.gov/lau/stalt_moave.xlsx | ||||||
Between 2008 and 2010, the civilian labor force fell by 32,200, but the number of people who want a job increased by a much smaller 6,700. Thus, most of those who left the labor force are unaccounted for in the BLS data on underutilized labor. Some probably left the state and others likely retired.
What is striking about Table 2 is the sharp increase in the number of involuntary part-time workers, from 24,600 in 2008 to 51,400 in 2010. These people are still counted as employed and in the labor force. Thus, among those who still held onto their jobs, many more of them reluctantly settled for part-time employment, and even those who continued to work full -time may have taken pay cuts. The labor underutilization ratio rose from 2.2 in 2007 to 2.4 in 2010, meaning that underemployment was worsening. The official unemployment rates for Hawaii don’t present a complete picture of the state of employment in Hawaii during and after deep economic contractions. One needs to look at the BLS’s labor underutilization statistics to gain a complete picture of the state of work in Hawaii. This has important policy implications. You manage what you measure. By focusing narrowly on the official unemployment rate, government aid that is directed only at the unemployed may miss an even larger cohort of involuntary part-time workers (and those that left the labor force) who may not qualify for assistance.
Even though the Great Recession of 2007-2009 lasted only 18 months in the U.S., employment in Hawaii did not return to the pre-recession level until 2014. And that’s without protracted travel quarantines, business shutdowns and stay-at-home orders. The number of involuntary part-time workers did not fall to the 2007 level until 2019. UHERO’s most recent (baseline) forecast envisions total employment not returning to its pre-pandemic level until 2029. Social safety net programs and job re-training and education programs all deserve more attention to avoid a lost decade for Hawaii’s underemployed.