By Ron Lee and Andy Mason
Changes in population age structure have important implications for the economies of all countries irrespective of their level of development. One reason age structure is so important is that children consume but produce little or nothing through their own labor. To survive and prosper they must depend on transfers from adults – their parents, of course, but also tax payers. High material standards of living are harder to achieve in countries with young populations, because the number of productive adults is low relative to the number of dependent children. Fertility decline has led to a demographic dividend as the number of dependent children has declined relative to the number of working-age adults. This phenomenon is captured by trends in the support ratio, a key summary measure shown in the Interactive Data Explorer. Other things equal, output per consumer is proportional to the support ratio, and the rate of growth of output per consumer equals the rate of growth of the support ratio.

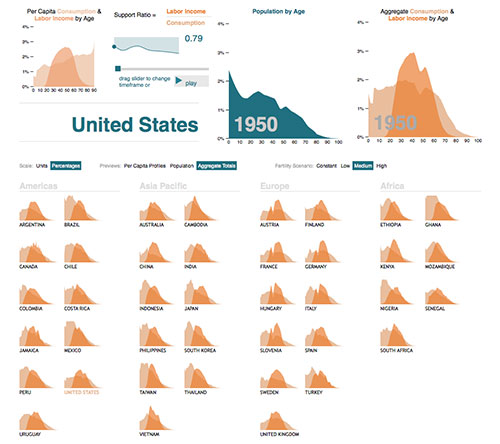
The Interactive Data Explorer is based on National Transfer Accounts (NTA) and population estimates and projections for forty countries that vary greatly in their level of development, social, political and economic systems, and demographics. The interactive tool can be used to explore the economic role of age structure since 1950 and to assess the likely influence of demography over coming decades. The support ratio is a useful summary measure, but it is also important to drill more deeply into the data, a task made easier by the data explorer.
The rise in the support ratio or what we call the “first demographic dividend” can be seen by tracing the past of most high-income countries and many developing countries that now have low levels of fertility. South Korea’s support ratio, for example, increased from 0.67 in 1973 to 0.95 in 2006, a gain of over 30 percent. In some countries, like China and Vietnam, the gains are even greater. The Interactive Data Explorer shows that in other countries the first demographic dividend is more modest and that many African countries are just beginning to experience it.
An important question: Why does the support ratio rise more in some countries than others? One of the most important factors is the speed of fertility decline. The importance of this factor can be judged using the Interactive Data Explorer by selecting a country and a year in the future and then by choosing among alternative fertility scenarios. For Ethiopia in 2060, for example, the projected support ratio is 0.90 for the “Medium” fertility scenario as compared with 0.71 if fertility remains constant at the current level.
The economic impact of changing age structure depends on features of the economic lifecycle as measured by per capita consumption and labor income by age in National Transfer Accounts. On average, the gap between consumption and labor income is less for children and older adults in lower income countries than in higher income countries. In higher income countries, spending on the costly education of each child is relatively high, and often consumption by the elderly is much higher than consumption by younger adults. This can be seen by setting the Preview to “Per Capita Profiles” and looking at the thumbnails for 40 countries. (Spending on education, health, and other components of consumption is available in NTA but not shown in the data explorer.) General patterns can be seen in the per capita profiles, but also the importance of country-specific features. In a number of African countries the gap between consumption and labor income is high even among those in their 20s. This results in a depressed support ratio.
The rise in the support ratio is a transitory phenomenon and as populations begin to age the support ratio inevitably drops to lower levels. To see why this happens, pick a country, set Scale to “Percentages”, and press “play”, watching the upper right figure titled “Aggregate Consumption and Labor Income by Age”. Instead of high consumption among children, we have high consumption among the elderly. The transition is particularly strong in rapidly aging societies in East Asia and parts of Europe.
Fertility also plays a role here and given the low fertility scenario, aggregate consumption by the elderly would reach very high levels in many countries at time goes on. This can be seen by choosing some future year such as 2050 and varying the fertility level. The rise in old age consumption has a silver lining, however, to the extent that the elderly fund their own consumption by accumulating wealth or capital during their working years. Under these circumstances, the growth in old-age consumption will lead to a second demographic dividend as higher capital fuels development in the host country and possibly in other countries through higher rates of foreign investment.
BLOG POSTS ARE PRELIMINARY MATERIALS CIRCULATED TO STIMULATE DISCUSSION AND CRITICAL COMMENT. THE VIEWS EXPRESSED ARE THOSE OF THE INDIVIDUAL AUTHORS. WHILE BLOG POSTS BENEFIT FROM ACTIVE UHERO DISCUSSION, THEY HAVE NOT UNDERGONE FORMAL ACADEMIC PEER REVIEW.