BLOG POSTS ARE PRELIMINARY MATERIALS CIRCULATED TO STIMULATE DISCUSSION AND CRITICAL COMMENT. THE VIEWS EXPRESSED ARE THOSE OF THE INDIVIDUAL AUTHORS. WHILE BLOG POSTS BENEFIT FROM ACTIVE UHERO DISCUSSION, THEY HAVE NOT UNDERGONE FORMAL ACADEMIC PEER REVIEW.
By Byron Gangnes
To most of us, faster economic growth is a good thing. It reduces unemployment, raises profits and wages, and generates healthier government fiscal situations. (Of course, some might worry about the pressures of rapid growth on the environment.) But the Federal Reserve is concerned that continued strong growth in the US economy is threatening its ability to limit long-term inflation to 2% and achieve maximum employment. Does this mean we have too much of a good thing?
The economy’s speed limit
The sustainable rate at which an economy can grow is determined by available resources and the rate of productivity growth, that is, how much output can be obtained from employing labor, capital, and raw materials. We call the sustainable rate of output growth the rate of growth of “potential real GDP.” This, if you like, is the economy’s “speed limit.”
To be sure, growth can exceed potential GDP during periods of cyclical recovery, just as it falls short during recessions. A period of above trend growth is driven by a short-run burst of increased demand. But this cannot persist forever without generating inflationary pressures as demand persistently exceeds supply. The speed limit, then, describes the long-term rate that the economy can continue to grow without generating excessive inflation.
What is the speed limit of the US economy today? Probably something less than 2% real GDP growth per year. And it will likely drop further in coming years. Where do these numbers come from?
The long-run view: Labor force growth will slow further
The key resource for production is the nation’s labor force, and that growth has been declining over time. In recent decades, annual labor force growth peaked at more than 2.5% back in the 1970s, when the large Baby Boom cohort and many women entered the labor force for the first time. It has fallen steadily since then. According to the Congressional Budget Office (CBO), annual US labor force growth will drop from about 0.5% in the 2010s to 0.4% over the next ten years, and to 0.2% by the 2043-2053 period.
Potential output growth depends on growth in available labor, but also on productivity growth, which for now we will take to mean all contributions to real GDP growth other than the growth of the labor force. Since 1980, productivity measured this way has averaged 1.5% per year, stronger in some decades, and weaker in others. It was generally stronger before 1970, when manufacturing was a larger part of the economy—it is easier to grow productivity in manufacturing by adding more and better capital for each worker, compared with service activities. It was particularly weak in the 1970s, in part because of the huge capital investments needed to increase energy efficiency just to produce the same output.
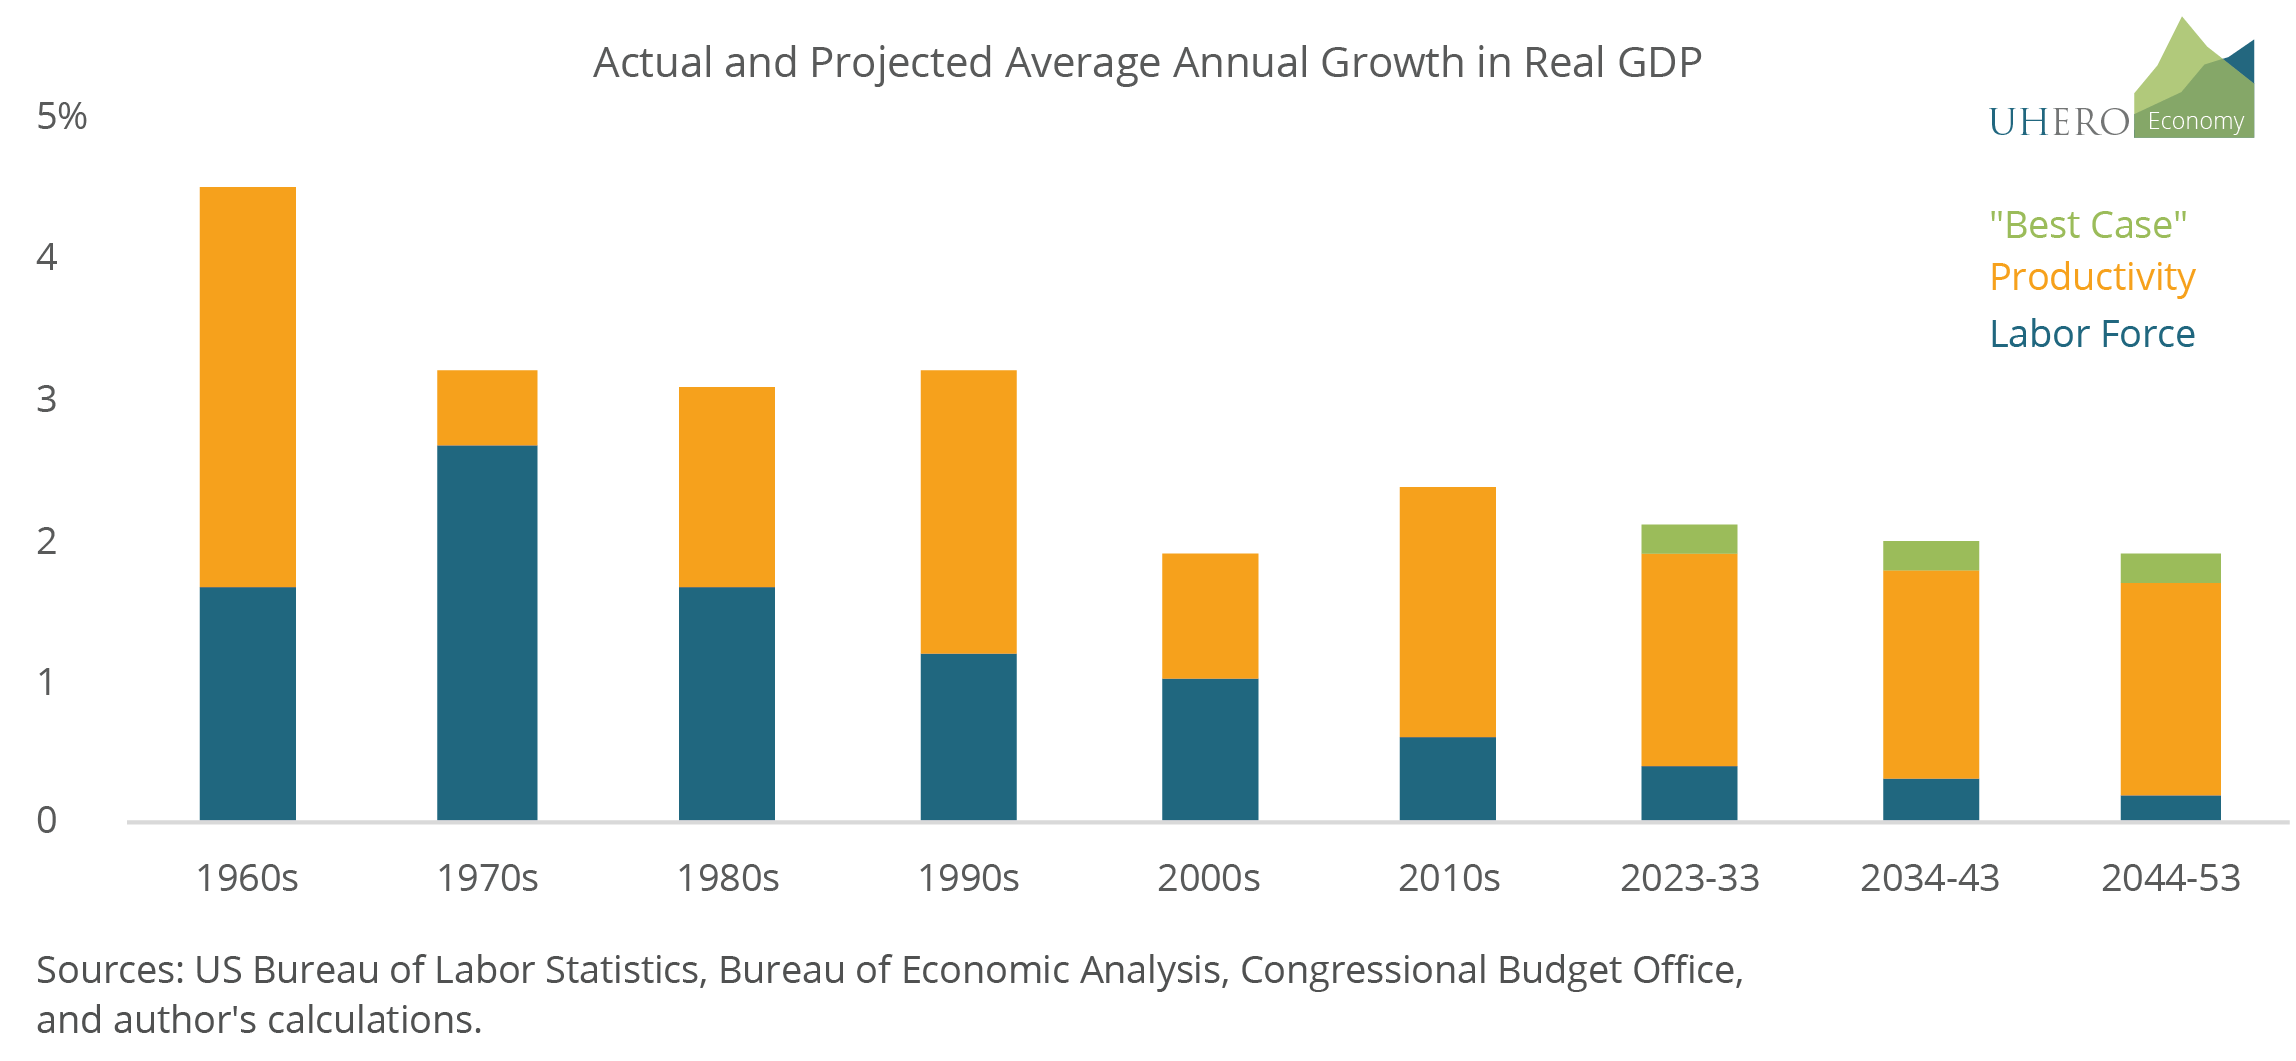
If we assume the same average rate of productivity growth in the future as in the past (1.5%), then potential real GDP would average less than 2% growth over the next decade. If you assume that productivity manages the better 1.7% annual growth of the 1980s-1990s, then a “best case” would see real GDP growth a bit above 2%, falling below 2% by mid-century.
Can we increase the economy’s speed limit?
While slower labor force growth will weigh on the economy’s speed limit, we have seen that future productivity growth will be an important factor. Often, this is measured by Total Factor Productivity (TFP): the amount of output that can be produced using the key inputs of labor and capital (to economists, capital means primarily buildings and equipment). When TFP growth is higher, it boosts productive capacity more rapidly, raising the return to labor and capital. It creates stronger demand for workers and capital investment, spreading the benefits of technological improvement more broadly without generating inflation. This makes TFP growth the most important driver of increases in the standard of living.
Is it possible that productivity growth might be higher than in the past? Yes, but this is almost completely unknowable. The roll-out of artificial intelligence (AI) might create a period of above-normal growth, as might some unknown but fundamental genomic advance. (A recent report by Goldman Sachs predicts that AI could raise annual global labor productivity growth by 1.5% over a ten-year period.) Or there could be some other revolutionary discovery that we can’t imagine at this point. But we will also have to support an increasingly aging population, which will require more resources and could slow growth.
The difficulty of predicting new technologies and their effects on productivity is evident from past episodes. A familiar example is the advent of low-cost computing beginning in the late 1970s and early 1980s. It would have been very difficult to predict the reach of this technology prior to the invention of the first microprocessor in the 1970s and certainty prior to the first integrated circuits in the late 1950s. This permitted the rise of desktop computing and innovations in telecommunications, supply chain management, and e-commerce. But even after the advent of cheap computing, statisticians struggled to find compelling evidence of impacts on overall productivity. As Robert Solow once observed, “The computer age was everywhere except for the productivity statistics.” The benefits of computing technology eventually appeared in the productivity measures, but significantly after computers were widely adopted. On this basis, the most reasonable productivity forecasts are simply based on historical trends rather than any newly emerging technologies like AI.
And it is important to note that labor force growth, while far easier to project than productivity, also has its uncertainties. The most important unknown is future immigration policy. Even the modest rates of labor force growth assumed by the CBO and others would require the continuation of immigration at recent rates, since “natural” growth of the labor force will turn negative as aging causes deaths to outstrip births by about 2040.
Overall, most economists are skeptical of a significant increase in the economy’s “speed limit,” and instead expect slowing in coming decades.
Unemployment: How low can we go?
So, it remains likely that slower labor force growth and an aging society will reduce the speed limit of the economy over time. But if labor force growth is a key constraint, why not try to keep the unemployment rate as low as possible?
We often look to the unemployment rate as a summary measure of labor market conditions. That rate simply measures the proportion of the labor force (those employed and those looking for work) who are not currently employed. (For a nice discussion of the value of unemployment statistics, see this post by Guy Berger.) Low unemployment is clearly good since it means more of the willing labor force is employed, and even lower unemployment tends to pull into the labor force would-be workers who are often harder to employ: veterans, the disabled, returning mothers, minorities, and ex-convicts. But unemployment can also be too low.
In October, the rate of unemployment edged up to 3.9%. While that is higher than the 3.4% recorded as recently as April, it remains below estimates of the rate consistent with equilibrium in the labor market and sustainable non-inflationary economic growth.
There are various yardsticks one can use to assess the level of the unemployment rate consistent with long-run equilibrium in the labor market. The measure favored by most economists is the non-accelerating inflation rate of unemployment. A mouthful, so NAIRU for short. This is sometimes also called the “natural rate” of unemployment. Some unemployment is necessary for the normal functioning of an economy, the result of voluntary separations as workers look for better jobs, of entry and exit from the labor force, and to provide a pool of workers for new and expanding businesses. Unemployment below that rate not only puts upward pressure on wages and prices, but it can cause inflation to grow at an increasing rate, as higher inflation drives higher wages and other input costs, which feed through into higher inflation, and so on and so on.
The NAIRU is not a known number but must be estimated. To make things challenging, it varies over time because of changes in the structure of the economy that influence how low unemployment can be pushed before price pressures mount. For example, the NAIRU was high during the 1970s and early 1980s as the large Baby Boom cohort—and especially women—entered the labor force. Because it takes more time to match new entrants with jobs, unemployment was pushed upward. After that time, the NAIRU trended downward, but it jumped again in the 2000s because of industrial shifts following the Global Financial Crisis and the damaging effects of long-term unemployment.
As you might imagine, one can find many estimates of the NAIRU; below, I show the one produced by the Federal Reserve Board. Other estimates of equilibrium unemployment rates simply take out of the data the swings in joblessness due to the business cycle, the periodic expansions and contractions of the economy. The graph below includes one such estimate from the Congressional Budget Office.
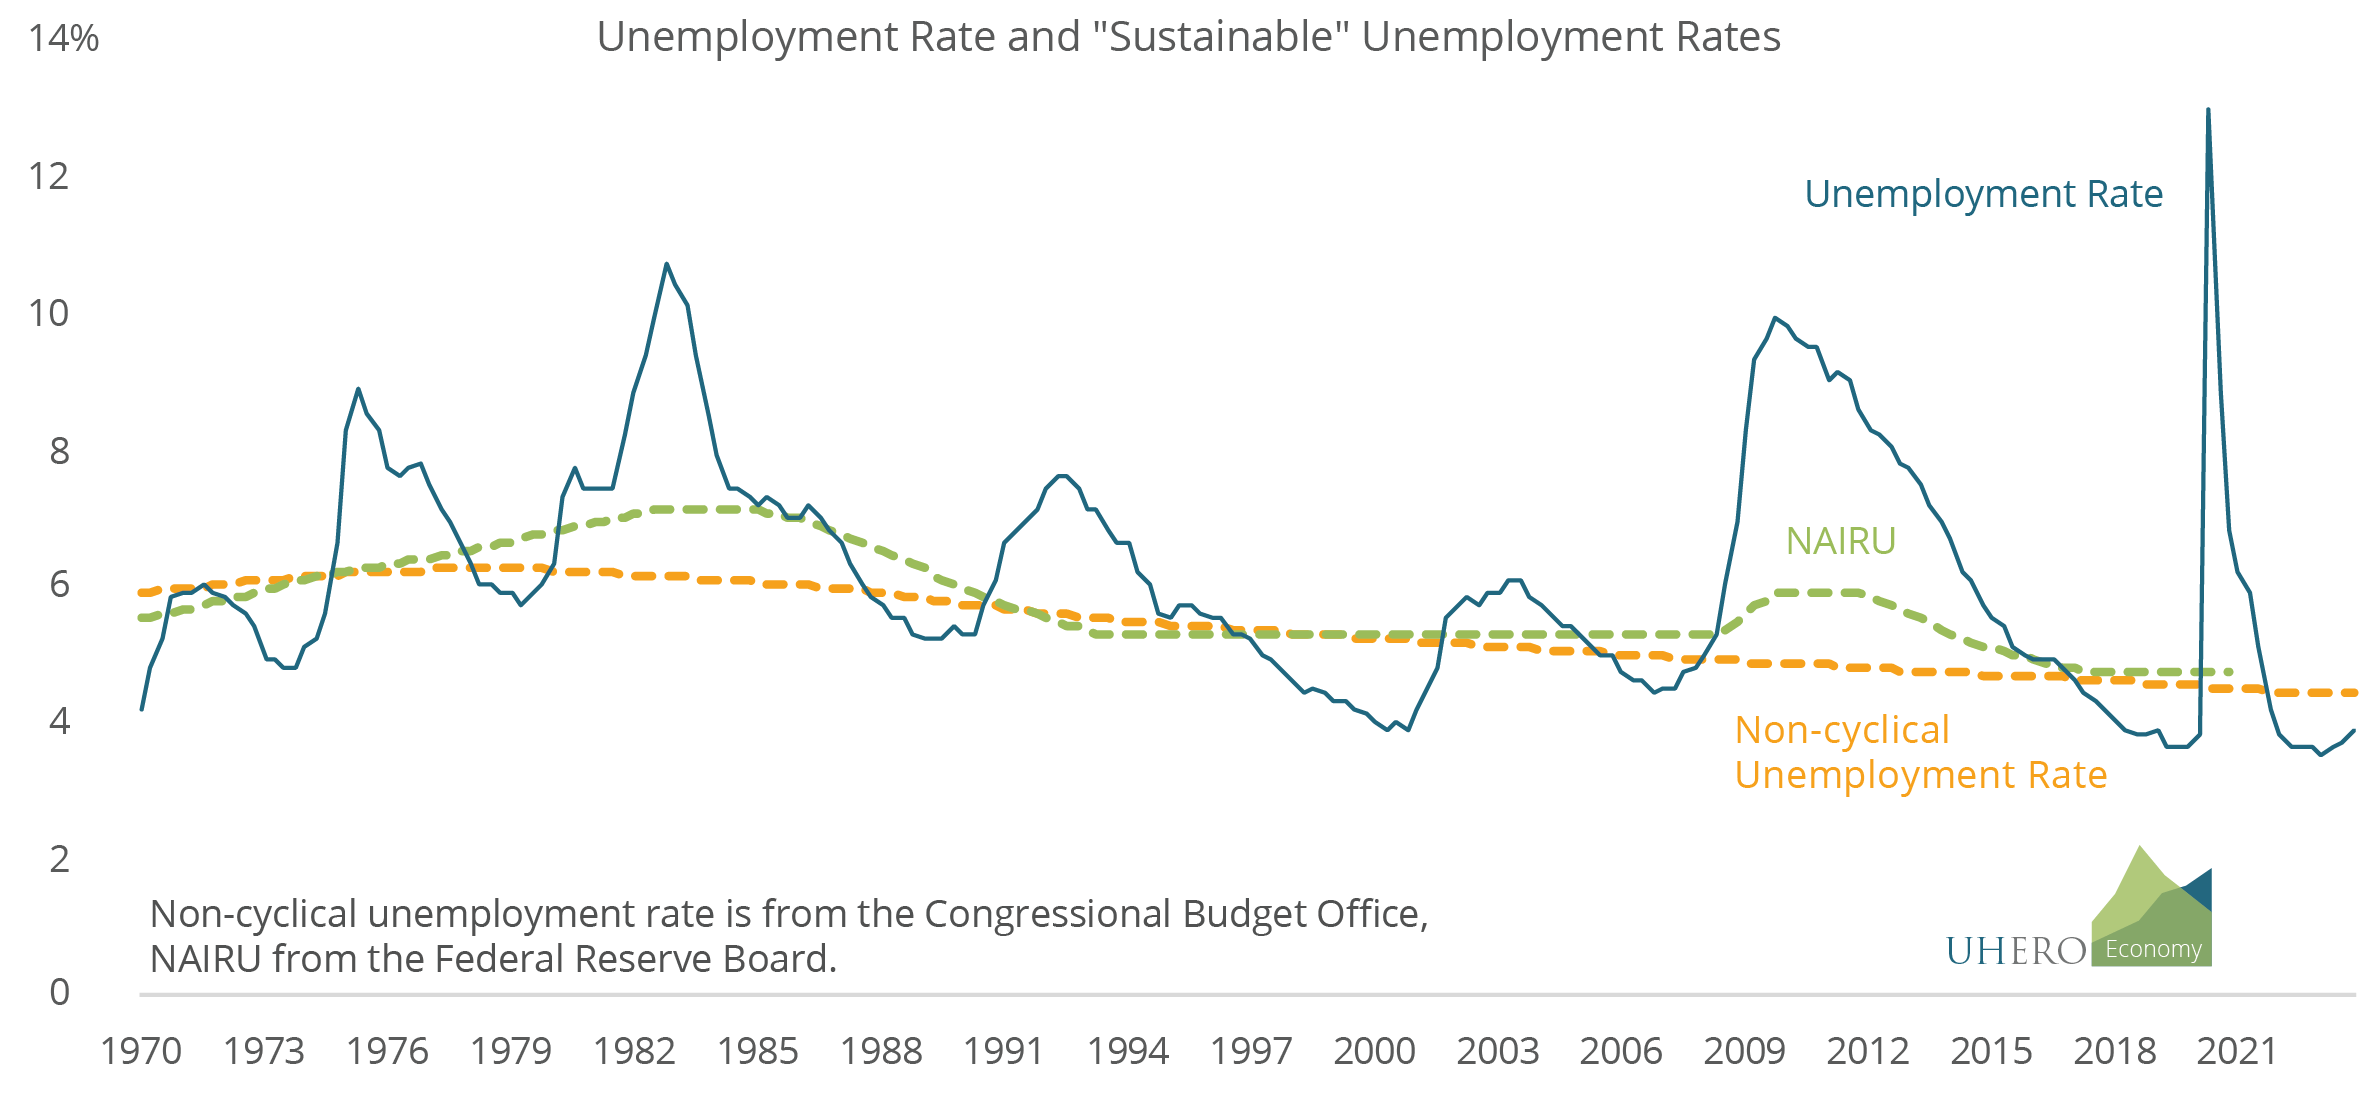
You can think of either measure as an indication of what unemployment rate is “sustainable” over the long term, in the sense that it is the lowest rate consistent with low and stable inflation. By these measures, the current 3.9% unemployment rate is between a half-percentage point and a full percentage point below a sustainable rate.
The near-term view: What unemployment should we expect?
Where might unemployment be headed now? Notice that it depends on changes in both labor supply and demand. Labor supply has been rising over the past year, as some workers sidelined by the pandemic have finally returned to the labor force. With the labor force participation rate of prime age workers now at an all-time high, it is likely that there will be only limited additional labor force growth in the near term.
If near-term labor force growth is limited, then labor demand must slow in order for unemployment to drift upward to a sustainable level. And in fact, we have already seen broad evidence of labor demand slowing. Job openings, which have been much higher than normal, have begun to ease, as to some extent has monthly job creation. Nominal wage inflation is falling back, but only very gradually. While these factors have eased, labor markets remain relatively tight by historical standards.
Some further softening of labor market conditions is necessary to eliminate excess demand pressures that would exert upward pressure on wages and the inflation rate. That will permit the unemployment rate to edge up to a level that is consistent with long-run equilibrium in the labor market, allowing the economy to converge onto a path of sustainable real output growth and the sought-after “soft landing.”
But dangers abound. Very tight monetary policy conditions risk slowing the economy too much, as might financial market fragility resulting from very high rates. Recently, this has spilled over to the long-term Treasury market, and burgeoning federal borrowing needs may keep long-term rates high. While households remain in generally good economic shape, and household debt levels are moderate relative to income, the burden of financing consumer credit is being pushed up by higher interest rates. The risk, then, is that as we feel the full effects of Fed tightening, they will have slowed the economy too much, pushing us into recession and causing unemployment to surge above its sustainable rate, resulting in widespread hardship for American families.
Despite these risks, it remains likely that the rise in unemployment in coming months will be moderate, moving up to the 4.5-5% level, just at or above NAIRU estimates. This reflects my view that the US economy will enter (or flirt with) recession in 2024, but that it will be a mild downturn by historical standards.
Takeaways:
- There is a speed limit for the economy’s long-run (potential) GDP growth that is determined by labor force and productivity growth. Potential GDP growth is likely below 2% and will fall further in coming decades. Innovation could raise this, but these effects are unknown.
- Along the potential GDP path, labor market conditions that are not excessively inflationary require unemployment to trend toward the NAIRU, or natural rate, somewhere between 4.5% and 5%.
- At present, while the labor market has cooled considerably, further softening and a rise in the unemployment rate will be necessary if we are to achieve a soft landing and sustainable growth thereafter.
Acknowledgements: Special thanks to Steven Bond-Smith for helpful comments and suggestions.