By Carl Bonham, Peter Fuleky, and Byron Gangnes
A significant part of Hawaii’s economy has effectively been shut down to slow the spread of the coronavirus in the Islands. The mandatory fourteen-day self-quarantine requirement for arriving visitors and residents has largely put a stop to tourism. And the stay-at-home order for all non-essential workers that shuttered many businesses is just now beginning to be relaxed. The unprecedented pause in economic activity has had a profoundly negative impact on Hawaii, with a sharp drop in spending, employment, and income. The key question as we look forward is how rapidly economic conditions will improve as the positive effects of government relief measures are felt and as restrictions are gradually eased over the coming weeks or months. In this blog, we describe how we are developing baseline assumptions about Hawaii’s recovery, as well as potential alternative paths. Such assumptions will be key drivers of the economic forecasts for Hawaii that we will be releasing later this month.
Before attempting to establish reasonable scenarios for the economy’s future path, we need to have a good understanding of where we are. In fact, this is tricky. The impact of the precipitous changes of recent weeks is difficult to assess because most official government statistics are released with a considerable delay. But a limited number of available high frequency indicators and reasonable assumptions about exposure to shut-down restrictions can be used to gauge the extent and distribution of losses we have experienced so far. Airline passengers to the state declined from more than 30,000 per day to an economically negligible 500-600 per day recently. Reservations at restaurants dropped even before mandatory rules brought them to zero, and a sharp reduction in residents’ mobility suggests that activity across a broad swath of the economy has declined to less than half its pre-crisis level.
Job losses due to COVID19 accumulated during late March and April, with initial claims for unemployment compensation surging by 200,000 during this period. This represents 30% of the February labor force. The number of layoffs differs across industries depending on their exposure to the two main channels of COVID19 impact: 1) the halt to tourism and 2) the stay-at-home order for local residents. Industries that predominantly cater to visitors (for example, accommodations) are primarily affected by the first channel, but most industries are affected to varying degrees through both channels. Since the available unemployment claims data do not provide industry or occupation identifiers, we must make assumptions about the distribution of job losses across sectors, taking into account their sensitivity to the decline in tourism and the stay-at-home order. These assumptions are informed by results from a recent survey UHERO conducted with the Chamber of Commerce Hawaii and other organizations. [1]
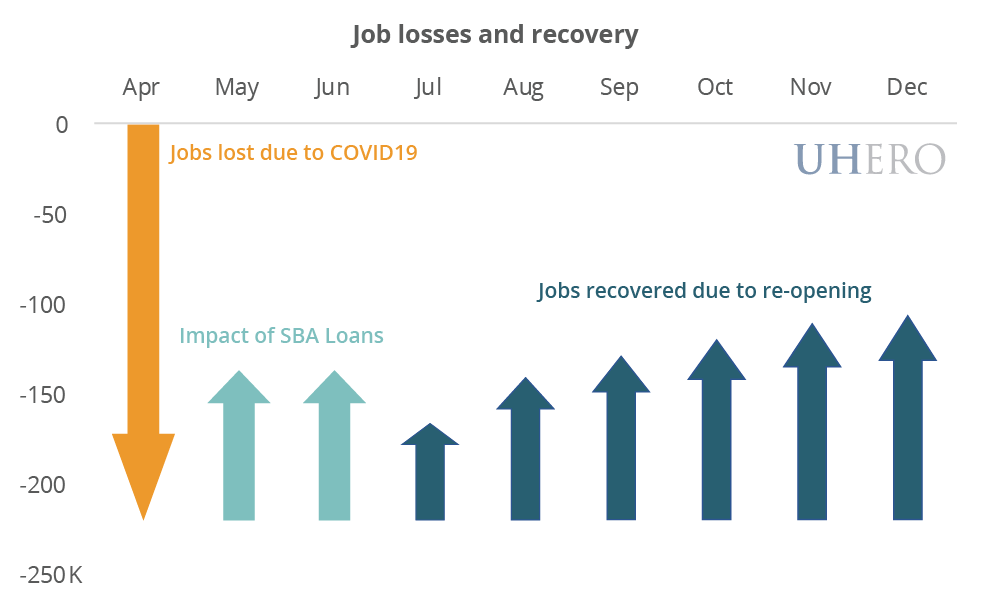
Because most COVID19-related job losses occurred after the US Bureau of Labor Statistics and Hawaii Department of Labor and Industrial Relations surveyed local establishments in March, the number of non-farm payroll jobs reported for the first quarter remained relatively stable. We estimate that job losses peaked at about 220,000 in April, with about 116,000 of those job losses attributable to the tourism halt and the remaining 104,000 jobs resulting from the stay-at-home order. [2] During May and June, the labor market will benefit from the forgivable Small Business Administration loans provided under the CARES Act Paycheck Protection Program (PPP). The maximum amount of these loans is equivalent to 2.5 months of payroll costs, and the covered period is eight weeks. The terms of the loan require that not more than 25% of the forgiven amount may be used to cover non-payroll costs. This implies that 75% of the loan is used for personnel costs and the remainder for other business expenses.
Using information on PPP loans by industry and prevailing pay rates, we are able to estimate the number of industry jobs that will be supported by the program. Specifically, we divide 75% of the aggregate value of approved loans in each industry by an estimate of the supported payroll earnings of an employee in that industry. The implied total number of jobs supported by the $2.2 billion of loans approved to date is 165,000. We estimate that an additional 7,000 jobs may be supported by the Payroll Support Program for Airlines. But because these programs allow funds to be used to retain employees still on company payrolls, only a fraction of the loan amounts will actually result in re-hiring previously laid-off employees. This fraction varies by industry. Under our assumptions, the aggregate impact of the CAREs act Payroll Protection and Support Programs will be to reverse roughly 83,000 of the job losses that have already occurred. Taking all of this into account, we estimate that average payroll employment for the second quarter will be about 165,000 lower than it was in the first quarter of the year.
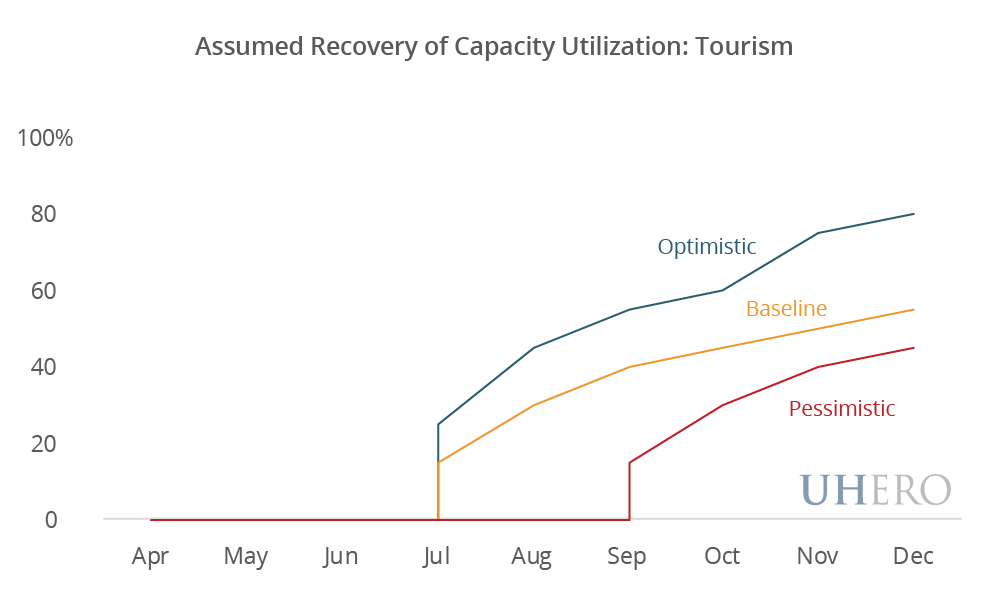
Beyond the temporary effects of the PPP, our scenarios for the economic activity in a particular future month are determined by assumptions about when restrictions will be lifted and the rate of increase in capacity utilization once those restrictions are gone. The timing and degree of recovery in tourism is highly uncertain, but it is likely to be very attenuated. We assume that progress in rolling out screening, testing, and tracing of visitors will allow for re-opening of the visitor industry by the last week of July, but that the pace of visitor return will be very slow. Specifically, we assume third-quarter arrivals recover to only 28% of their fourth quarter 2019 level, and that capacity use will linger at low levels through the end of the year, held back by consumer reluctance to resume long-haul travel, pocketbook challenges, and the probability of localized virus flare-ups in some visitor markets or in Hawaii itself. By December, only half of the arrivals lost to the pandemic will have been recovered in our baseline scenario.
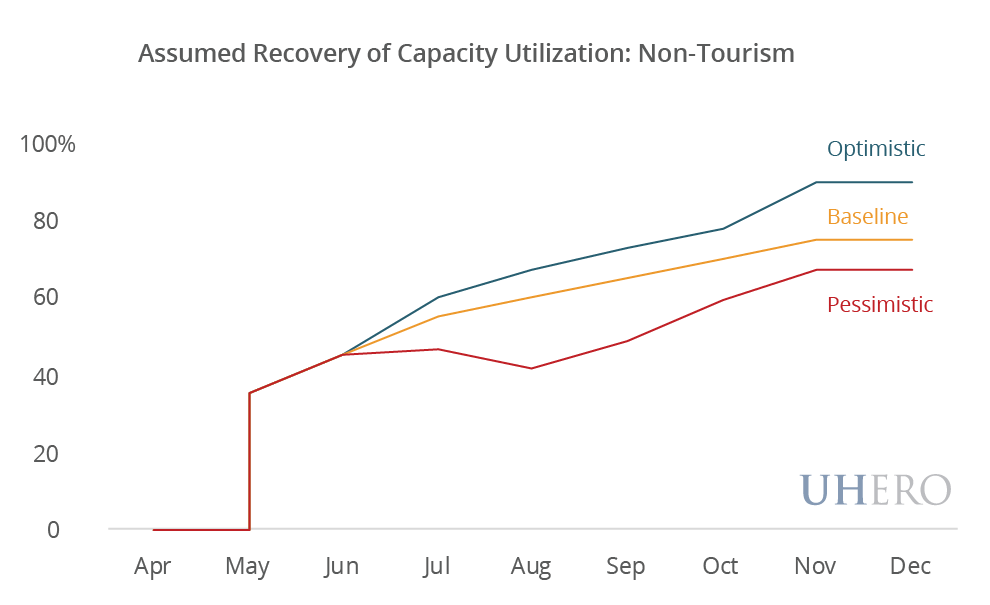
The pace of recovery of the non-tourism economy will be more rapid than for tourism, but will still be measured. We assume that the process of reopening businesses will continue gradually in May, and that once the stay-at-home order is lifted, local consumption will ramp up slowly at first as businesses and consumers adjust to a “new normal.” In May and June, we assume the return of 35-45% of the business activity lost during the most extensive period of local economy shut-down in April. By December, 75% of economic activity lost due to the stay-at-home order will have been reversed. The less-than-complete recovery reflects macroeconomic weakness, ongoing costs of measures to preserve social distancing, and spillover effects from persistent low levels of tourism.

Note that the projected gradual re-opening of the economy should be enough to offset most of the drag that will come when the Paycheck Protection Program is phased out at the end of the second quarter (however, July will see a net decline). By the fourth quarter of this year, of the 220,000 lost jobs due to COVID19, 110,000 will have been recovered. While this will represent significant progress, the unemployment rate will likely remain well into double-digits at year end.
Needless to say, these calculations require heroic assumptions about a number of factors, including the progression of the pandemic, the pace of policy change, behavioral responses of local residents and visitors, and the impacts of sustained low levels of activity and higher operating costs on business survival or failure. In formulating our baseline scenario, we are making our best judgment about these issues, given information available at this time. Because of the tremendous uncertainty, we turn next to a discussion of what we think represent reasonable alternative scenarios.
A more pessimistic scenario is fairly easy to envision. On the tourism side, the challenges of screening, testing, and contact tracing are daunting, relying both on Hawaii’s readiness and willingness to accept significant visitor numbers and access to—and confidence in—testing measures that can be required of potential visitors. Continuing mainland virus spread and flare-ups are not unlikely, considering the way the virus has marched across mainland states and communities and the possible resurgence in areas where premature reopenings are made. In our pessimistic scenario, then, we assume no significant tourism reopening until the last week of September, eliminating all of the summer high season. Progress thereafter is slow, and the winter high season is still below 50% of normal. A delay of significant tourism reopening will pose tremendous challenges for the industry, and, absent significant additional federal support, will very likely lead to bankruptcies and additional loss of jobs. With a more attenuated recovery of tourism activity and business failures in the industry, the recovery of the non-tourism economy will face increased drag from overall macroeconomic weakness. Further, “local” restaurants or other businesses that rely only partially on tourism spending—and operate with thin margins in the best of times—may either fail to reopen or begin to fail once federal support has ended.


A more positive scenario than what we have established as a baseline is very much dependent on testing capacity and the spread of the virus. For tourism, the optimistic scenario is consistent with rapid increase in test availability nationally within just the next two months, so that a moderate return of visitors is possible by late summer. Good control over the virus on the US mainland and abroad would permit further recovery as the year progresses. Even under this optimistic scenario, we see lingering traveler concerns, high business costs of maintaining social distancing, and a deep US and global recession combining to limit the extent of visitor industry recovery this year. Visitor arrivals losses would remain significant through December. For locally-focused firms, the main developments that would support a more optimistic outcome are a robust public health environment, with testing, tracing, and isolation efforts that contain the virus in Hawaii and a speedier pace of tourism recovery that generates direct spillovers and a stronger macroeconomic environment. In the optimistic scenario, we assume that by autumn businesses catering primarily to the local market recover about 80-85% of the decline in their level of activity. Persisting social-distancing measures would continue to impose significant ongoing costs.
Assumptions of the type laid out here are necessary as we continue to work on updating our forecasts for the Hawaii economy. They are of course fraught with challenges. As others have pointed out, the vast uncertainty inherent in the current environment argues for a scenario approach that envisions alternative possible futures rather than excessive focus on a single numerical baseline path. Even with this in mind, it is important to acknowledge that the scenarios we are developing can in no way encompass the range of all possible outcomes. These will depend of course on medical aspects of the crisis: the epidemiological course of a wholly-new virus and an unknown period before which a vaccine becomes available. They will also be affected by the extent of additional policy responses to the pandemic and to the macroeconomic fallout. Finally, there are uncertainties about the way that people will adjust their behavior under a new normal that for some time will include social distancing measures and fear of close social interaction. As clarity on these issues emerges, we will be updating these scenarios to inform the range of possible outcomes for the Hawaii economy.
BLOG POSTS ARE PRELIMINARY MATERIALS CIRCULATED TO STIMULATE DISCUSSION AND CRITICAL COMMENT. THE VIEWS EXPRESSED ARE THOSE OF THE INDIVIDUAL AUTHORS. WHILE BLOG POSTS BENEFIT FROM ACTIVE UHERO DISCUSSION, THEY HAVE NOT UNDERGONE FORMAL ACADEMIC PEER REVIEW.
[1] Thanks to Chamber of Commerce Hawaii, The Hawaii Island, Kauai and Maui Chambers of Commerce, The Retail Merchants Association of Hawaii, the Pacific Resource Partnership, Hawaii State Bar Association, Hawaii Restaurant Association, the Chinese Chamber, Kalihi Business Association, the Hawaii Food Manufacturing Association, and Hawaii Foreign-Trade Zone for help promoting the survey.
[2] Our estimate of the number of jobs lost in April is higher than the 200,000 initial unemployment claims to allow for the likelihood that some workers have been unable to file claims, or they have not yet been processed. Our estimate is also consistent with the results from the UHERO/COC survey results. Finally, note that the number of jobless claims reported in the press appears to be the number of applications received for unemployment insurance and apparently includes duplicate applications, and may include self-employed claimants who are not yet included in the weekly initial claims data.


