BLOG POSTS ARE PRELIMINARY MATERIALS CIRCULATED TO STIMULATE DISCUSSION AND CRITICAL COMMENT. THE VIEWS EXPRESSED ARE THOSE OF THE INDIVIDUAL AUTHORS. WHILE BLOG POSTS BENEFIT FROM ACTIVE UHERO DISCUSSION, THEY HAVE NOT UNDERGONE FORMAL ACADEMIC PEER REVIEW.
By Carl Bonham, Peter Fuleky, Byron Gangnes, and Justin Tyndall
A year ago Hawaii was operating under its first COVID-19 Stay at Home Order. As business activity contracted, the state quickly shed more than 150,000 jobs, and the unemployment rate jumped from 2% to 22%. Today there is hope that the devastation brought by the pandemic will soon be a bad memory, as the successful rollout of vaccines accelerates and a growing share of Hawaii’s population becomes fully vaccinated. At the same time, it is important to recognize that the ultimate goal of herd immunity remains months away. And failing to meet that goal could lead to continuing social, health, and economic losses for years to come. Below we illustrate the potential costs of failing to achieve vaccination goals, using simulations based on recent experience.
We begin with assumptions about the pace of vaccinations and targets to reach herd immunity. There is no single definition of what it will take to reach herd immunity. Here we adopt the target of fully vaccinating 75% of the state population with either a 2-shot or 1-shot vaccine. Scientists expect that taming COVID-19 will require between 70% and 85% of the population having immunity. The actual percentage of the population that must be vaccinated to reach a state where the virus no longer spreads will depend on the extent of immunity from those already infected, and the real-world effectiveness of the vaccines, particularly against emerging variants.
To estimate how long it will take to reach this 75% target, we use data from the US Centers for Disease Control on the number of vaccines administered, the mix of one- and two-shot vaccine types and the number Hawaii residents already completely and partially vaccinated. The mix of vaccine types has been dominated by the two-shot variety manufactured by Moderna and Pfizer and has remained relatively stable. (At the time of this writing, use of the one-shot Johnson & Johnson vaccine has been put on hold pending review of cases of rare blood clots.) But as illustrated by Figure 1, the number of administered doses has fluctuated wildly. This is reportedly due to a combination of reporting lags and variation in the availability of vaccines.
Figure 1: Vaccine delivery has gone through some wild swings.
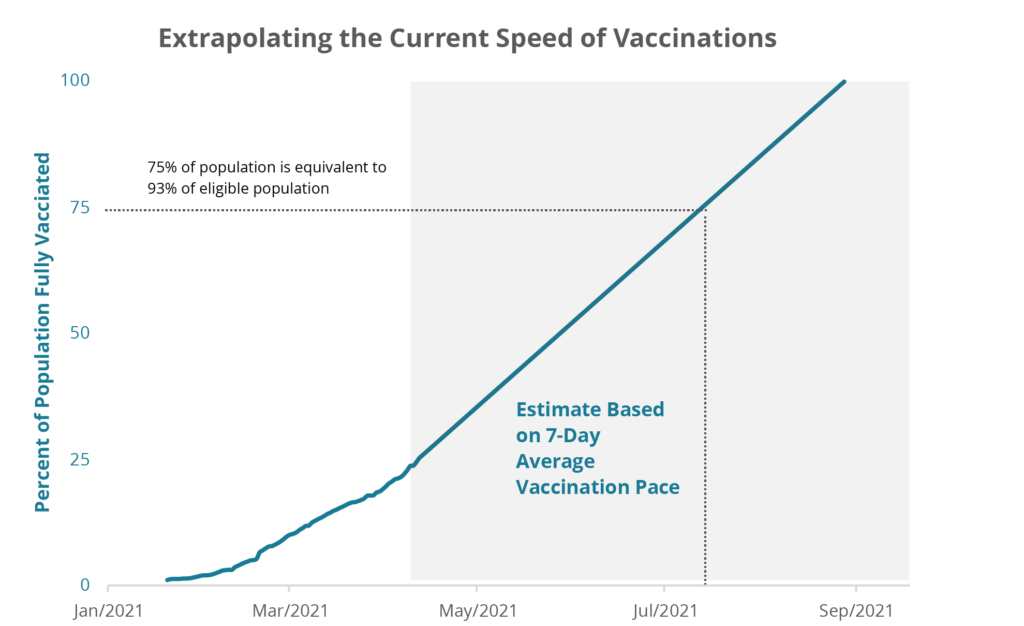
Starting with the number of adults already vaccinated, and a target of 75% of Hawaii’s 2019 population of 1.42 million people, we assume that the mix and the number of doses administered will remain unchanged at their most recent seven-day average. As of April 15, about 380 thousand residents have been fully vaccinated, while about 161 thousand are awaiting their second shot [1]. Over the past week, the number of vaccines administered rose to an average of about 13.8 thousand per day. Assuming that the state is able to administer this many vaccines every day from now through summer, we will vaccinate 75% of the state’s population by the first week of July [2].

Figure 2: We could approach herd immunity by July 7th if vaccinations continue at their current pace.
It is important to note that 75% of the state’s population is equivalent to 93% of the state’s 16 and older population currently eligible for vaccination. Pfizer has applied for Emergency Use Authorization for vaccinating children aged 12-15. And before the recent pause of the JJ vaccine, the State was apparently expecting that many more doses would be available in coming weeks. A recent Hawaii News Now story reported that, “By the end of May, health officials expect to have 1.5 million doses of the vaccine administered,” enough to vaccinate 70% of the 16 and older population. Getting to that point would require a large and sustained increase in the number of doses administered daily, something that appears possible, but would require increases in both the supply of and continuing demand for the vaccine.
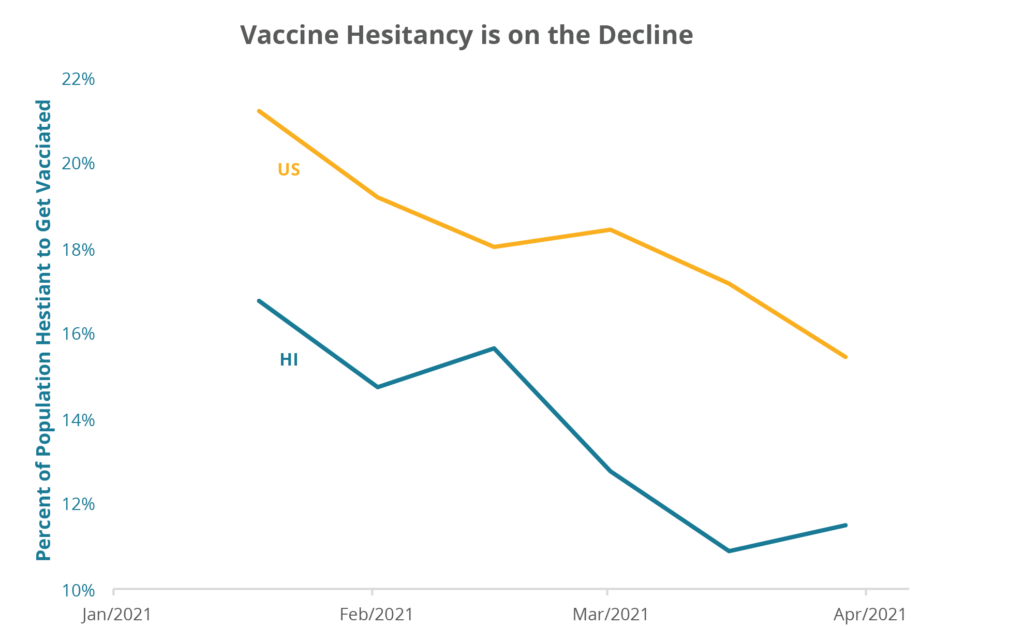
In particular, we will be watching the willingness of the unvaccinated population to get the vaccines. Recent survey data from the Census Bureau finds that 11% of the adult population in Hawaii say they “probably” or “definitely” will not get a vaccine. Encouragingly, the share of the population who report being unlikely to get vaccinated has been falling quickly, and is significantly lower than for the country as a whole, as shown in Figure 3. Still, there remains much work to be done to ensure that Hawaii vaccinates the largest possible number of eligible residents. In the most recent survey, of the roughly 123 thousand adults reporting that they were unlikely to be vaccinated, 63% were under the age of 40. And as the UK variant becomes the dominant source of coronavirus infections nationally, the CDC reports that nationally, “hospitals are seeing more younger adults — people in their 30s and 40s who are admitted with “severe disease.” Finally, as the prevalence of COVID-19 cases in the community declines, some with reservations about vaccines may decide to “free-ride” on the behavior of others, leaving Hawaii just short of our herd immunity goal. Such possibilities justify even greater effort to communicate the importance of individuals getting vaccinated to help both themselves and others.

Figure 3: The share of the Hawaii population who are resistant to getting vaccinated has been falling and is much lower than for the US overall.
Hawaii has an opportunity to fully vaccinate its population in coming months and become one of the safest places in the country to live, work, or visit. A failure to achieve large-scale immunization could have long term adverse consequences, including further mutations of the virus, health complications in infected individuals, a continuing drain on the healthcare system, and further economic damage. To focus on the economic consequences, consider Hawaii’s nascent but promising recovery from the COVID-19 induced recession.
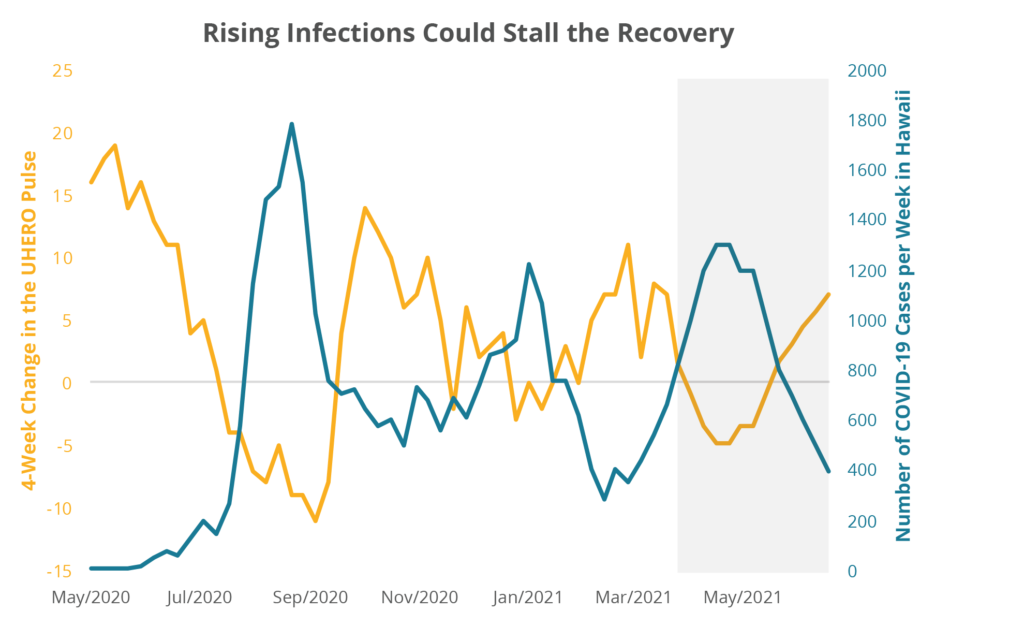
Economic activity in Hawaii has been trending upward since last fall. According to the UHERO Economic Pulse, which summarizes a number of indicators of current economic conditions, about 60% of the economic losses from April/May 2020 have been recovered so far. But the progress has not been monotonic. And changes in economic activity are clearly associated with fluctuations in COVID-19 prevalence. In particular, an increase in case counts has typically been followed by a pause in recovery. The recent jump in cases suggests that the recovery momentum could stall. And if the case count were to surge further–for example to the level of about 150 daily cases observed during the winter surge–economic activity as measured by the UHERO Economic Pulse would likely decline. This is illustrated in Figure 4, below.

Figure 4: A hypothetical rise in infections to January 2021 levels would suggest a period of declining economic activity.
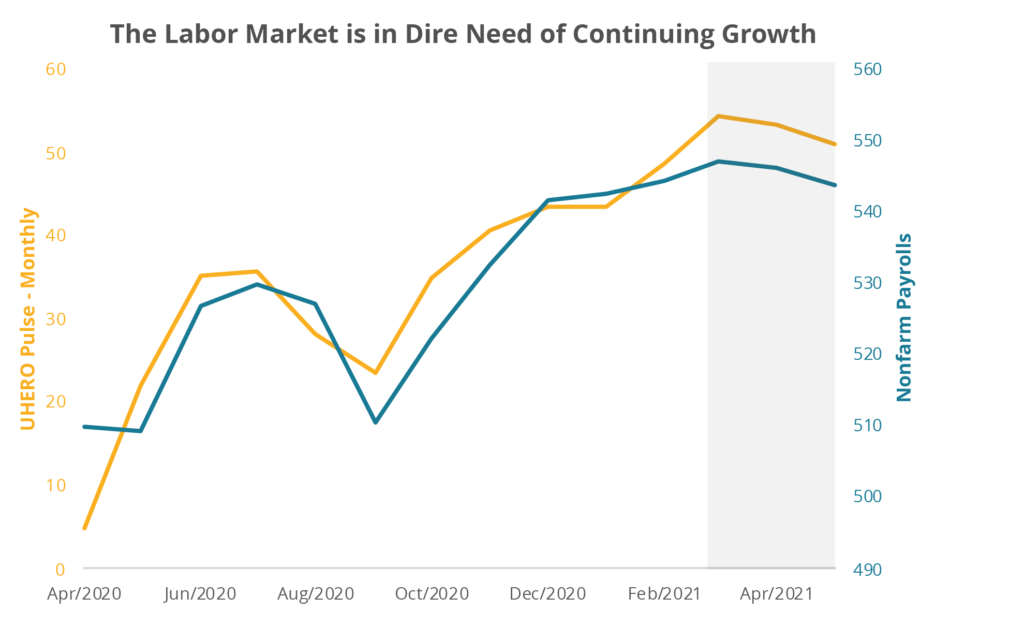
The UHERO Economic Pulse has been a good predictor of monthly nonfarm payrolls. Over the past year a twelve-point increase in the UHERO Economic Pulse has been associated with a gain of about ten thousand jobs. Figure 5 illustrates this tight relationship and the impact on both variables of a hypothetical rise of infections to January 2021 levels.

Figure 5: Nonfarm payrolls would decline if infections were to rise significantly.
These scenarios based on the historical relationship between new COVID-19 Cases, the UHERO Economic Pulse, and Hawaii payroll job counts are not a perfect indicator of how our economy would be affected by a potential future rise in cases, because they do not take into account the rising share of fully vaccinated adults in both Hawaii and the country as a whole. Still, they illustrate the importance of keeping our eye on the prize of herd immunity. Attaining widespread vaccination is an important step toward solidifying our nascent recovery and preventing economic backsliding. Herd immunity will not immediately return us to the pre-pandemic state of affairs, but the sooner we can get the COVID-19 pandemic under control, the more certain will be economic growth prospects
1 The data available from the Centers for Disease Control and Prevention does not include every dose that has been administered in the state. As of the beginning of April, the State Department of Health has modified their reporting of vaccine counts to include doses administered via the Federal Pharmacy program, Federal Agency doses as well as State administered doses. After consistently reporting about 100 thousand fewer doses than the CDC,the State DoH is now reporting about 140 thousand more doses. As of this writing, we have not been able to reconcile these differences based on DoH or CDC documentation. We are using CDC data because the full time series of doses as well as the share of complete and partial vaccinations can be accessed daily via API.
2 Using the DoH count of 1 million doses administered by April 15, and assuming the same 7-day average vaccination rate, we estimate that 75% of the state’s population could be vaccinated by June 28.